Civil Society, NGOs, and Decent Work Policies: Sorting out the Issues
Civil Society, NGOs, and Decent Work Policies: Sorting out the Issues
Civil Society, NGOs, and Decent Work Policies: Sorting out the Issues

You also want an ePaper? Increase the reach of your titles
YUMPU automatically turns print PDFs into web optimized ePapers that Google loves.
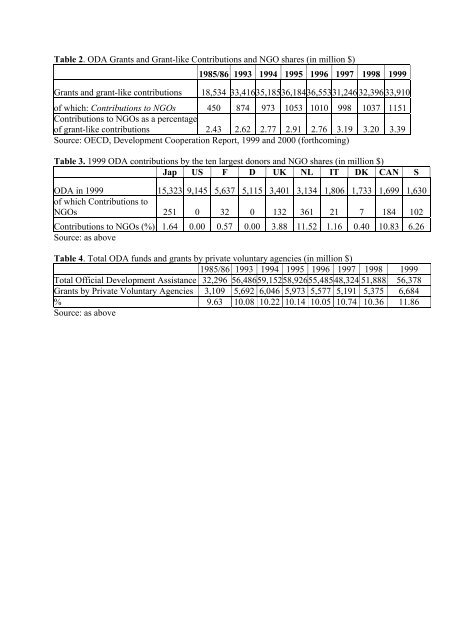
Table 2. ODA Grants <strong>and</strong> Grant-like Contributions <strong>and</strong> NGO shares (in million $)<br />
1985/86 1993 1994 1995 1996 1997 1998 1999<br />
Grants <strong>and</strong> grant-like contributions 18,534 33,41635,18536,18436,55331,246 32,396 33,910<br />
of which: Contributions to <strong>NGOs</strong> 450 874 973 1053 1010 998 1037 1151<br />
Contributions to <strong>NGOs</strong> as a percentage<br />
of grant-like contributions 2.43 2.62 2.77 2.91 2.76 3.19 3.20 3.39<br />
Source: OECD, Development Cooperation Report, 1999 <strong>and</strong> 2000 (forthcoming)<br />
Table 3. 1999 ODA contributions by <strong>the</strong> ten largest donors <strong>and</strong> NGO shares (in million $)<br />
Jap US F D UK NL IT DK CAN S<br />
ODA in 1999 15,323 9,145 5,637 5,115 3,401 3,134 1,806 1,733 1,699 1,630<br />
of which Contributions to<br />
<strong>NGOs</strong> 251 0 32 0 132 361 21 7 184 102<br />
Contributions to <strong>NGOs</strong> (%) 1.64 0.00 0.57 0.00 3.88 11.52 1.16 0.40 10.83 6.26<br />
Source: as above<br />
Table 4. Total ODA funds <strong>and</strong> grants by private voluntary agencies (in million $)<br />
1985/86 1993 1994 1995 1996 1997 1998 1999<br />
Total Official Development Assistance 32,296 56,48659,15258,92655,48548,324 51,888 56,378<br />
Grants by Private Voluntary Agencies 3,109 5,692 6,046 5,973 5,577 5,191 5,375 6,684<br />
% 9.63 10.08 10.22 10.14 10.05 10.74 10.36 11.86<br />
Source: as above