- Page 1 and 2: SYSTEM ANALYSIS THROUGH BOND GRAPH
- Page 3 and 4: 3 STATEMENT BY AUTHOR This disserta
- Page 5 and 6: 5 DEDICATION To Shannon, for her un
- Page 7 and 8: TABLE OF CONTENTS (continued) 4.3.3
- Page 9 and 10: 9 LIST OF FIGURES Figure 3.1. Power
- Page 11 and 12: LIST OF FIGURES (continued) Figure
- Page 13 and 14: LIST OF FIGURES (continued) Figure
- Page 15 and 16: 15 LIST OF TABLES Table 3.1. Effort
- Page 17 and 18: 17 CHAPTER 1: Introduction 1.1 Prob
- Page 19 and 20: 19 Chapter 5 provides a means of me
- Page 21 and 22: 21 CHAPTER 2: Related Work 2.1 Intr
- Page 23 and 24: 23 dissipated energy in the form of
- Page 25 and 26: 25 of a thermo-fluid bond graph can
- Page 27 and 28: 27 between the describing parameter
- Page 29 and 30: 29 variables associated with it. Na
- Page 31 and 32: 31 3.2.2 Bond Graph Junctions Power
- Page 33 and 34: 33 power. They are called 1-port el
- Page 35 and 36: 35 the conjugate variables. As seen
- Page 37 and 38: 37 As seen in figure 3.6 the power
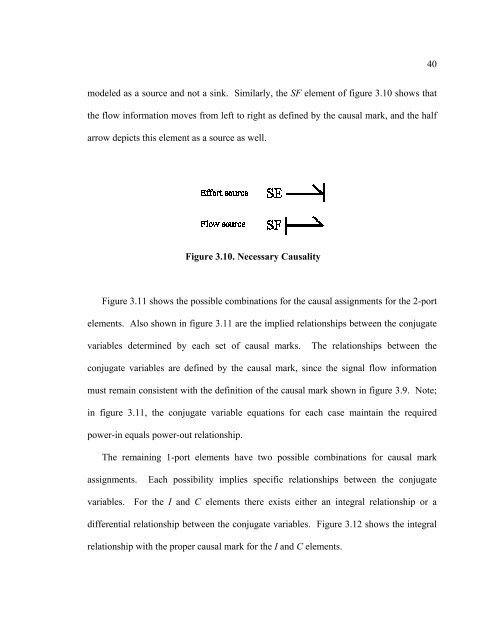
- Page 39: 39 between all of the variables are
- Page 43 and 44: 43 Figure 3.14. Possible Causal Ass
- Page 45 and 46: 45 3.2.7 Bond Graph Causal Mark Ass
- Page 47 and 48: 47 information is obvious from the
- Page 49 and 50: 49 3. Use the conjugate variables a
- Page 51 and 52: 51 3.2.9 Conversion of Bond Graph V
- Page 53 and 54: 53 obtaining dynamic equations, and
- Page 55 and 56: 55 3.3.1 Lagrangian to Hamiltonian
- Page 57 and 58: 57 dL ∂L ∂L ∂L & (3.22) ∂q
- Page 59 and 60: 59 An underlying assumption in the
- Page 61 and 62: 61 7. Develop the Hamiltonian for t
- Page 63 and 64: 63 The partial of the Lagrangian wi
- Page 65 and 66: 65 bond graph shows a single degree
- Page 67 and 68: 67 of a Lagrangian/Hamiltonian appr
- Page 69 and 70: 69 d dt through 3.48 and the simple
- Page 71 and 72: 71 since flows sum around a 0-junct
- Page 73 and 74: 73 2 2 ( + A′ )& θ − ( A + B
- Page 75 and 76: 75 of the bond graph, i.e., they ar
- Page 77 and 78: 77 The simplest bond graph equation
- Page 79 and 80: 79 2 ( A + B′ )&& φ sin θ + ( A
- Page 81 and 82: 81 ω & 3 = θ (3.102) The method d
- Page 83 and 84: 83 Also, the bond graph maps the fl
- Page 85 and 86: 85 4.2 Dymola The Dymola framework
- Page 87 and 88: 87 such that the user can assign a
- Page 89 and 90: 89 A possible set of equations for
- Page 91 and 92:
91 Vδ1 = V 2 −V1 Vδ 2 = Vi −V
- Page 93 and 94:
93 The icon window has been left bl
- Page 95 and 96:
95 derive the equations for a bond
- Page 97 and 98:
97 ⎡ 1 ⎛ q ⎤ B4 ⎞ 1 ⎛ qB4
- Page 99 and 100:
99 f f f 2 3 1 : : : x 2 1 1 1 x 1
- Page 101 and 102:
101 4.2.3.1 Structural Singularitie
- Page 103 and 104:
103 Figure 4.10. Gear Train Bond Gr
- Page 105 and 106:
105 This section shows that bond gr
- Page 107 and 108:
107 [Pan88]. Also, note that the co
- Page 109 and 110:
109 The iconic representation of th
- Page 111 and 112:
111 Figure 4.14. A-Causal Bond As s
- Page 113 and 114:
113 The bond models are complete an
- Page 115 and 116:
115 Figure 4.19. Three-Port One The
- Page 117 and 118:
117 Figure 4.22 shows a bond graph
- Page 119 and 120:
119 Figure 4.25. C-Element Model Fi
- Page 121 and 122:
121 The transformer model defines t
- Page 123 and 124:
123 Figure 4.32. Modulated Effort S
- Page 125 and 126:
125 from the bond graph 3-tuple, an
- Page 127 and 128:
127 Figure 4.38. Q Sensor Naturally
- Page 129 and 130:
129 These models can now be used to
- Page 131 and 132:
131 Figure 4.43. Gyroscope Model: E
- Page 133 and 134:
133 4.4.2 Inertial Rate Sensor Mode
- Page 135 and 136:
135 The gyroscope in figure 4.45 is
- Page 137 and 138:
137 4.4.2.3 Roll Gyro Figure 4.50 s
- Page 139 and 140:
139 Figure 4.53. Sensor Delays The
- Page 141 and 142:
141 As seen in figure 4.55, the pla
- Page 143 and 144:
143 The icon labeled Platform_Cntrl
- Page 145 and 146:
145 pointed at a fixed inertial poi
- Page 147 and 148:
147 in the camera, a pitch command
- Page 149 and 150:
149 The icon of the completed model
- Page 151 and 152:
151 inertial axes. These inertial c
- Page 153 and 154:
153 The yaw achieved response is sh
- Page 155 and 156:
155 80 Camera: Pitch Pitch Angle (d
- Page 157 and 158:
157 bond graph and drop it into a h
- Page 159 and 160:
159 can be used to monitor the syst
- Page 161 and 162:
161 5.2.1 Servo Positioning System:
- Page 163 and 164:
163 diode is seen in figure 5.3 as
- Page 165 and 166:
165 Figure 5.5. Gear Train and Fin
- Page 167 and 168:
167 The modulated effort source is
- Page 169 and 170:
169 Figure 5.7. Linear Fin Dynamics
- Page 171 and 172:
171 Here the electrical dynamics ar
- Page 173 and 174:
173 Similarly, the state space equa
- Page 175 and 176:
175 Magnitude (dB) 50 0 -50 -100 -1
- Page 177 and 178:
177 showing up on terms (3, 4) and
- Page 179 and 180:
179 outputs are fin position and se
- Page 181 and 182:
181 5.4 Servo Controllers Separate
- Page 183 and 184:
183 Figure 5.14. Linear Controller/
- Page 185 and 186:
185 5.4.3 Non-Linear Control Scheme
- Page 187 and 188:
187 Figure 5.17. Content of the Y3
- Page 189 and 190:
189 The power signal vector is pass
- Page 191 and 192:
191 6 5 (deg) Step: Hinge Moment =
- Page 193 and 194:
193 1.5 x 10⁶ 5 (deg) Step: Hinge M
- Page 195 and 196:
195 PID1 delivers less energy to th
- Page 197 and 198:
197 Figure 5.28 shows a clear and c
- Page 199 and 200:
199 The step responses and efficien
- Page 201 and 202:
201 Figures 5.34 and 5.35 correspon
- Page 203 and 204:
203 Figures 5.38 and 5.39 correspon
- Page 205 and 206:
205 Figure 5.40. Two Non-Linear Act
- Page 207 and 208:
207 Figure 5.43 through 5.47 show t
- Page 209 and 210:
209 5.3 5 (deg) Step: Hinge Moment
- Page 211 and 212:
211 Figures 5.49 through 5.54 show
- Page 213 and 214:
213 20.3 20.2 20 (deg) Step: Hinge
- Page 215 and 216:
215 CHAPTER 6: Optimal Gain Compari
- Page 217 and 218:
217 need to be optimized further, o
- Page 219 and 220:
219 S ref C N 2 πd = (6.3) 4 2 1.5
- Page 221 and 222:
221 Figure 6.5 shows a Dymola model
- Page 223 and 224:
223 The equations used to execute t
- Page 225 and 226:
225 Angle of attack and body accele
- Page 227 and 228:
227 A Dymola model of the above aut
- Page 229 and 230:
229 1 3-Loop AP: -12.92 G step resp
- Page 231 and 232:
231 Figure 6.18. Three Loop AP: Clo
- Page 233 and 234:
233 6 3-Loop AP: -12.92 G step resp
- Page 235 and 236:
235 than the missile response. Prop
- Page 237 and 238:
237 Equation 6.15 shows that C N is
- Page 239 and 240:
239 M δ Q * S * d * C ref Mδ I yy
- Page 241 and 242:
241 5 0 5 Deg. Fin Deflection, at S
- Page 243 and 244:
243 0 -0.5 3 Loop AP: -12.92 G step
- Page 245 and 246:
245 can be exploited to place the c
- Page 247 and 248:
247 Although equations 6.44 through
- Page 249 and 250:
249 Figures 6.32 through 6.34, show
- Page 251 and 252:
251 Figures 6.35 and 6.36, show how
- Page 253 and 254:
253 6 Complete System: -12.92 G ste
- Page 255 and 256:
255 view. Gain set 1 rises higher i
- Page 257 and 258:
257 Figures 6.43 and 6.44 show the
- Page 259 and 260:
259 compare controller efficiencies
- Page 261 and 262:
261 1.2 x 10⁻⁶ Complete System: -12
- Page 263 and 264:
263 It is interesting to note, that
- Page 265 and 266:
265 where −1 T K = −R B P (6.52
- Page 267 and 268:
267 ∂J − ∂t * = H 1 ⎛ ∂J
- Page 269 and 270:
269 u * = KC −1 * [ y − Du ] (6
- Page 271 and 272:
271 Where −1 ⎡1⎤ [ − K D] K
- Page 273 and 274:
−1 T ( Q − SR S ) 273 Ch = (6.1
- Page 275 and 276:
275 real matrix, and an imaginary m
- Page 277 and 278:
277 ~ the characteristic polynomial
- Page 279 and 280:
279 6.6.6 Nonlinear Autopilot Resul
- Page 281 and 282:
281 15 10 Complete System: -12.92 G
- Page 283 and 284:
283 0.07 Complete System: 1 G step
- Page 285 and 286:
285 7 Complete System: -12.92 G ste
- Page 287 and 288:
287 Shifting the cg towards the nos
- Page 289 and 290:
289 8 Complete System: -12.92 G ste
- Page 291 and 292:
291 much increase in efficiency red
- Page 293 and 294:
293 CHAPTER 7: Summary 7.1 Contribu
- Page 295 and 296:
295 Various control schemes were pr
- Page 297 and 298:
297 Naturally this expansion is not
- Page 299 and 300:
299 Real Hric[1, 2]; Real Lric[1, 1
- Page 301 and 302:
Text( extent=[-16, -62; 18, -80], s
- Page 303 and 304:
Modelica.Blocks.Interfaces.OutPort
- Page 305 and 306:
Text(extent=[36, 38; 78, 24], strin
- Page 307 and 308:
307 AB2 = A*AB1; AB3 = A*AB2; for j
- Page 309 and 310:
309 for j in 1:n loop Reigvec_outpu
- Page 311 and 312:
311 eig3[2] = eig_input.signal[7];
- Page 313 and 314:
313 APPENDIX A5: Dymola Models, Mis
- Page 315 and 316:
315 APPENDIX B1: Symmetry of Hamilt
- Page 317 and 318:
317 APPENDIX B2: Vandermonde Repres
- Page 319 and 320:
319 APPENDIX C: Glossary of Terms 2
- Page 321 and 322:
321 Cur84 Dym Elm94 Fah99 Fah94 Fav
- Page 323 and 324:
323 Mas91 Mat McB05a Maschke, B.,
- Page 325:
325 Zar02 Zei95 Zho96 Zarchan, P.,