Hydroxyproline assay - Treat-NMD
Hydroxyproline assay - Treat-NMD
Hydroxyproline assay - Treat-NMD

Create successful ePaper yourself
Turn your PDF publications into a flip-book with our unique Google optimized e-Paper software.
DMD_M.1.2.006<br />
6 EVALUATION AND INTERPRETATION OF RESULTS<br />
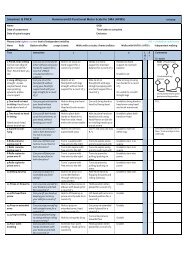
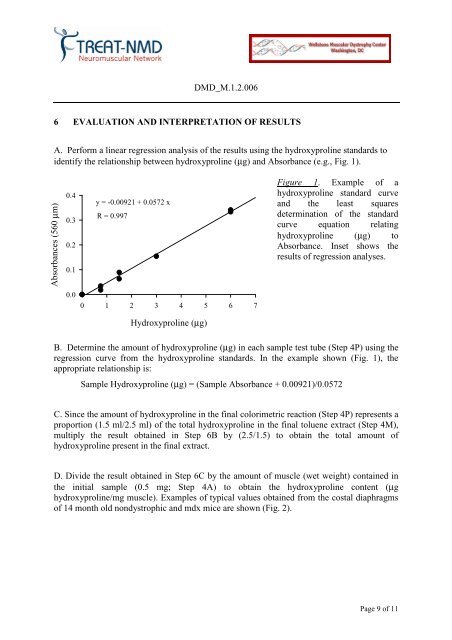
A. Perform a linear regression analysis of the results using the hydroxyproline standards to<br />
identify the relationship between hydroxyproline (µg) and Absorbance (e.g., Fig. 1).<br />
Absorbances (560 µm)<br />
0.4<br />
0.3<br />
0.2<br />
0.1<br />
y = -0.00921 + 0.0572 x<br />
R = 0.997<br />
Figure 1. Example of a<br />
hydroxyproline standard curve<br />
and the least squares<br />
determination of the standard<br />
curve equation relating<br />
hydroxyproline (µg) to<br />
Absorbance. Inset shows the<br />
results of regression analyses.<br />
0.0<br />
0 1 2 3 4 5 6 7<br />
<strong>Hydroxyproline</strong> (µg)<br />
B. Determine the amount of hydroxyproline (µg) in each sample test tube (Step 4P) using the<br />
regression curve from the hydroxyproline standards. In the example shown (Fig. 1), the<br />
appropriate relationship is:<br />
Sample <strong>Hydroxyproline</strong> (µg) = (Sample Absorbance + 0.00921)/0.0572<br />
C. Since the amount of hydroxyproline in the final colorimetric reaction (Step 4P) represents a<br />
proportion (1.5 ml/2.5 ml) of the total hydroxyproline in the final toluene extract (Step 4M),<br />
multiply the result obtained in Step 6B by (2.5/1.5) to obtain the total amount of<br />
hydroxyproline present in the final extract.<br />
D. Divide the result obtained in Step 6C by the amount of muscle (wet weight) contained in<br />
the initial sample (0.5 mg; Step 4A) to obtain the hydroxyproline content (µg<br />
hydroxyproline/mg muscle). Examples of typical values obtained from the costal diaphragms<br />
of 14 month old nondystrophic and mdx mice are shown (Fig. 2).<br />
Page 9 of 11