- Page 2:
Beginning Ajax with ASP.NET Wallace
- Page 6 and 7:
Beginning Ajax with ASP.NET Wallace
- Page 8 and 9:
Executive Editor Bob Elliott Senior
- Page 10 and 11:
About the Authors Wallace B. “Wal
- Page 12:
Acknowledgments It is truly interes
- Page 15 and 16:
Contents Manipulating the Style She
- Page 17 and 18:
Contents Chapter 7: Ajax.NET Profes
- Page 19 and 20:
Contents Chapter 11: Atlas Controls
- Page 22 and 23:
Introduction Thank you for purchasi
- Page 24 and 25:
Tips, hints, tricks, and asides to
- Page 26 and 27:
1 Introduction to Ajax on ASP.NET O
- Page 28 and 29:
Introduction to Ajax on ASP.NET Mic
- Page 30 and 31:
Introduction to Ajax on ASP.NET ❑
- Page 32 and 33:
Introduction to Ajax on ASP.NET ❑
- Page 34 and 35:
Who’s Using Ajax? Introduction to
- Page 36 and 37:
2 Introduction to DHTML Dynamic HTM
- Page 38 and 39:
Writing Your First Block of JavaScr
- Page 40 and 41:
Introduction to DHTML document.writ
- Page 42 and 43:
Introduction to DHTML Figure 2-3 Ex
- Page 44 and 45:
Introduction to DHTML The return ke
- Page 46 and 47:
Introduction to DHTML var isArrowLe
- Page 48 and 49:
Using the innerHTML Property Introd
- Page 50 and 51:
To illustrate this behavior, the ne
- Page 52:
Introduction to DHTML Now that you
- Page 55 and 56:
Chapter 3 From Static to Dynamic
- Page 57 and 58:
Chapter 3 Within the section of th
- Page 59 and 60:
Chapter 3 Just a reminder of what w
- Page 61 and 62:
Chapter 3 /* */ Datatypes These are
- Page 63 and 64:
Chapter 3 Composite types are requi
- Page 65 and 66:
Chapter 3 These sets of operators a
- Page 67 and 68:
Chapter 3 var y = 0; do { y = y + 1
- Page 69 and 70:
Chapter 3 Figure 3-1 shows the resu
- Page 71 and 72:
Chapter 3 This allows you to assign
- Page 73 and 74:
Chapter 3 Because the constructor i
- Page 75 and 76:
Chapter 3 This produces the result
- Page 77 and 78:
Chapter 3 window navigator location
- Page 79 and 80:
Chapter 3 There are four levels of
- Page 81 and 82:
Chapter 3 var featuresLevel1 = [“
- Page 83 and 84:
Chapter 3 Take a look at a simple e
- Page 85 and 86:
Chapter 3 For this particular examp
- Page 87 and 88:
Chapter 3 The method getElementById
- Page 89 and 90:
Chapter 3 Cloning a Node This
- Page 91 and 92:
Chapter 3 Node Type Type Descriptio
- Page 93 and 94:
Chapter 3 Figure 3-7 Figure 3-8 68
- Page 95 and 96:
Chapter 3 The DOM, Styles, and CSS
- Page 97 and 98:
Chapter 3 Try It Out Modifying a St
- Page 99 and 100:
Chapter 3 which includes a script f
- Page 102 and 103:
4 The XMLHttpRequest Object The XML
- Page 104 and 105:
The XMLHttpRequest Object above, Op
- Page 106 and 107:
The XMLHttpRequest Object while the
- Page 108 and 109:
The XMLHttpRequest Object The secon
- Page 110 and 111:
Using the responseText Property The
- Page 112 and 113:
The XMLHttpRequest Object As you ca
- Page 114 and 115:
Next listed in the following code b
- Page 116 and 117:
The XMLHttpRequest Object } // Exec
- Page 118 and 119:
The XMLHttpRequest Object Property
- Page 120 and 121:
The XMLHttpRequest Object - Select
- Page 122 and 123:
The XMLHttpRequest Object In additi
- Page 124 and 125:
The XMLHttpRequest Object xmlHttpOb
- Page 126 and 127:
The XMLHttpRequest Object at System
- Page 128 and 129:
5 Data Communication: XML, XSLT, an
- Page 130 and 131:
1986 by ISO standard “ISO 8879:19
- Page 132 and 133:
Consider the following code sample
- Page 134 and 135:
Data Communication: XML, XSLT, and
- Page 136 and 137:
Data Communication: XML, XSLT, and
- Page 138 and 139:
Data Communication: XML, XSLT, and
- Page 140 and 141:
Data Communication: XML, XSLT, and
- Page 142 and 143:
Data Communication: XML, XSLT, and
- Page 144 and 145:
Data Communication: XML, XSLT, and
- Page 146 and 147:
X Path Data Communication: XML, XSL
- Page 148 and 149:
Data Communication: XML, XSLT, and
- Page 150 and 151:
Data Communication: XML, XSLT, and
- Page 152 and 153:
6 What Is Built into ASP.NET ASP.NE
- Page 154 and 155:
What Is Built into ASP.NET
- Page 156 and 157:
What Is Built into ASP.NET
- Page 158 and 159:
What Is Built into ASP.NET ❑ ❑
- Page 160 and 161:
method. This method allows a develo
- Page 162 and 163:
What Is Built into ASP.NET Client/B
- Page 164 and 165:
What Is Built into ASP.NET Client/B
- Page 166 and 167:
What Is Built into ASP.NET // Get o
- Page 168 and 169:
What Is Built into ASP.NET using Sy
- Page 170 and 171:
What Is Built into ASP.NET Value S
- Page 172 and 173:
DataSet object with some data and s
- Page 174 and 175:
Dealing with the Returned Data on t
- Page 176 and 177:
What Is Built into ASP.NET // Add t
- Page 178 and 179:
What Is Built into ASP.NET } names.
- Page 180 and 181:
What Is Built into ASP.NET ❑ Para
- Page 182:
explicit server-side coding is requ
- Page 185 and 186:
Chapter 7 Acquiring Ajax.NET Pro Ve
- Page 187 and 188:
Chapter 7 The server-side code that
- Page 189 and 190:
Chapter 7 So, your entire server-si
- Page 191 and 192:
Chapter 7 What Is a Language Proxy?
- Page 193 and 194:
Chapter 7 Using strings will get yo
- Page 195 and 196:
Chapter 7 the name and street prope
- Page 197 and 198:
Chapter 7 Chapter7_ImageSwitcherCal
- Page 199 and 200:
Chapter 7 Checking for Null Values
- Page 201 and 202:
Chapter 7 The fourth script source
- Page 204 and 205:
8 Anatomy of Ajax.NET Pro Library T
- Page 206 and 207:
Anatomy of Ajax.NET Pro Library Fig
- Page 208 and 209:
Anatomy of Ajax.NET Pro Library Mas
- Page 210 and 211:
Line 25 creates the actual JavaScri
- Page 212 and 213:
Anatomy of Ajax.NET Pro Library 09.
- Page 214 and 215:
Anatomy of Ajax.NET Pro Library 19.
- Page 216 and 217:
Anatomy of Ajax.NET Pro Library 105
- Page 218 and 219:
What Is an Ajax.NET Pro Converter?
- Page 220 and 221:
9 Other Ajax Frameworks for .NET Aj
- Page 222 and 223:
Testing for Features Using the Sari
- Page 224 and 225:
Attaching an event to check for the
- Page 226 and 227:
The framework contains supporting c
- Page 228 and 229:
Other Ajax Frameworks for .NET lock
- Page 230 and 231:
Panels versus Custom Controls Once
- Page 232 and 233:
Other Ajax Frameworks for .NET cust
- Page 234 and 235:
Creating the Solution 1. Open Visua
- Page 236 and 237:
Other Ajax Frameworks for .NET Not
- Page 238 and 239:
Other Ajax Frameworks for .NET Swit
- Page 240 and 241:
Other Ajax Frameworks for .NET Figu
- Page 242 and 243:
Other Ajax Frameworks for .NET Imag
- Page 244 and 245:
Other Ajax Frameworks for .NET } }
- Page 246 and 247:
Other Ajax Frameworks for .NET feat
- Page 248 and 249:
Other Ajax Frameworks for .NET Figu
- Page 250 and 251:
Other Ajax Frameworks for .NET Figu
- Page 252 and 253:
Other Ajax Frameworks for .NET Figu
- Page 254 and 255:
Other Ajax Frameworks for .NET bord
- Page 256 and 257:
txtTitle_TextChanged event and will
- Page 258 and 259:
Other Ajax Frameworks for .NET Fina
- Page 260 and 261:
Other Ajax Frameworks for .NET
- Page 262 and 263:
Other Ajax Frameworks for .NET Fina
- Page 264 and 265:
Other Ajax Frameworks for .NET cont
- Page 266 and 267:
Other Ajax Frameworks for .NET The
- Page 268 and 269:
Other Ajax Frameworks for .NET back
- Page 270 and 271:
Other Ajax Frameworks for .NET Figu
- Page 272:
On the server side, ComfortASP.NET
- Page 275 and 276:
Chapter 10 ❑ Client-side componen
- Page 277 and 278:
Chapter 10 Now that you have heard
- Page 279 and 280:
Chapter 10 This code shows how an e
- Page 281 and 282:
Chapter 10 OnServerException Examin
- Page 283 and 284:
Chapter 10 } function ServerAddRetu
- Page 285 and 286:
Chapter 10 DataRow var strRowsInfo
- Page 287 and 288:
Chapter 10 { } return (objComplexCu
- Page 289 and 290:
Chapter 10 New Time:
- Page 291 and 292:
Chapter 10 function CallInternalWe
- Page 293 and 294:
Chapter 10 Number The Number class
- Page 295 and 296:
Chapter 10 The Sys.Data.DataColumn
- Page 297 and 298:
Chapter 10 The following is some co
- Page 299 and 300:
Chapter 10 NamespaceName.ClassName.
- Page 301 and 302:
Chapter 10 Inheritance Inheritance
- Page 303 and 304:
Chapter 10 Try It Out Implementing
- Page 305 and 306:
Chapter 10 Figure 10-14 Enumeration
- Page 307 and 308:
Chapter 10 Figure 10-16 282
- Page 309 and 310:
Chapter 10 Summary In this chapter,
- Page 311 and 312:
Chapter 11 var associatedElement =
- Page 313 and 314:
Chapter 11 Setting the EnablePartia
- Page 315 and 316:
Chapter 11 Just to show that there
- Page 317 and 318:
Chapter 11 How It Works In this exa
- Page 319 and 320:
Chapter 11 Now that you have seen t
- Page 321 and 322:
Chapter 11 Try It Out You will noti
- Page 323 and 324: Chapter 11 listView.set_layoutTempl
- Page 325 and 326: Chapter 11 Binding Directions As pr
- Page 327 and 328: Chapter 11 3. The validationErrorLa
- Page 329 and 330: Chapter 11 Regex Validation Exam
- Page 331 and 332: Chapter 11
- Page 333 and 334: Chapter 11 Hide Show
- Page 336 and 337: 12 Atlas Integration with ASP.NET S
- Page 338 and 339: Atlas Integration with ASP.NET Serv
- Page 340 and 341: Atlas Integration with ASP.NET Serv
- Page 342 and 343: ❑ ❑ ScriptFolder — In this co
- Page 344 and 345: Atlas Integration with ASP.NET Serv
- Page 346 and 347: Try It Out Retrieving Profile Prope
- Page 348 and 349: Atlas Integration with ASP.NET Serv
- Page 350 and 351: ❑ A special connectionString is u
- Page 352 and 353: Atlas Integration with ASP.NET Serv
- Page 354 and 355: 13 Debugging Debugging is the art o
- Page 356 and 357: Debugging Figure 13-2 In either cas
- Page 358 and 359: Using Alert Statements Starting wit
- Page 360 and 361: Try It Out Client-Side Script Debug
- Page 362 and 363: Debugging Figure 13-9 4. In the Scr
- Page 364 and 365: Debugging Figure 13-12 Right-clicki
- Page 366 and 367: So far, you have used F10 to advanc
- Page 368 and 369: Debugging Debugger Keyword Test Pa
- Page 370 and 371: Debugging Figure 13-16 Try It Out U
- Page 372 and 373: Debugging The Command window will h
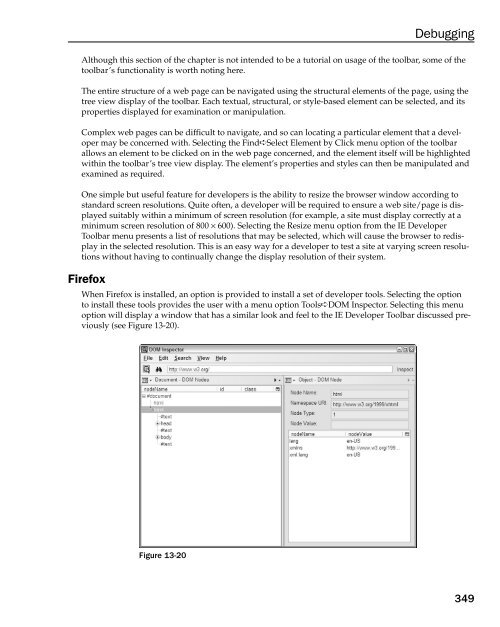
- Page 376 and 377: install the Venkman tool within Fir
- Page 378 and 379: Debugging true); xmlHttpObj.open(
- Page 380 and 381: Debugging TestFiddler.aspx.cs — C
- Page 382 and 383: Debugging Figure 13-25 This is usef
- Page 384 and 385: Debugging using System.Collections;
- Page 386 and 387: Debugging Replace the text button%2
- Page 388 and 389: A XSLT Commands This appendix provi
- Page 390 and 391: XSLT Commands Element preserve-spac
- Page 392 and 393: Boolean XSLT Commands The boolean f
- Page 394 and 395: XSLT Commands Name adjust-dateTime-
- Page 396 and 397: XSLT Commands Name Description subs
- Page 398: Index
- Page 401 and 402: AjaxPro.AjaxMethod() attribute Ajax
- Page 403 and 404: attributes (continued) attributes (
- Page 405 and 406: Command window Command window, 346-
- Page 407 and 408: document-uri(node) function (XSLT)
- Page 409 and 410: frameworks frameworks Ajax.NET Pro
- Page 411 and 412: functions (XSLT) (continued) functi
- Page 413 and 414: JavaScript (continued) JavaScript (
- Page 415 and 416: libraries (continued) libraries (co
- Page 417 and 418: methods (XSLT) (continued) methods
- Page 419 and 420: Microsoft Atlas project (continued)
- Page 421 and 422: port port 80, 103 port numbers in c
- Page 423 and 424: server-side frameworks (continued)
- Page 425 and 426:
value-of element (XSLT) value-of el
- Page 427 and 428:
XSLT elements (continued) XSLT elem