HOW CISCO SUCCEEDS A - IMPERIAL Logistics
HOW CISCO SUCCEEDS A - IMPERIAL Logistics
HOW CISCO SUCCEEDS A - IMPERIAL Logistics

You also want an ePaper? Increase the reach of your titles
YUMPU automatically turns print PDFs into web optimized ePapers that Google loves.
Risk Management<br />
sure for Cisco in addition to the risk of<br />
being single sourced, and Supplier Y, with<br />
a smaller revenue impact but with physical<br />
damage to one of its buildings.<br />
It turned out that the SCRM team,<br />
in conjunction with the Global Supplier<br />
Management function, had proactively been<br />
working to address the single-source risk with<br />
Supplier X and had already identified a second<br />
source a few months prior to the earthquake.<br />
However, the situation with Supplier Y<br />
remained an issue. A group within SCRM, the<br />
Crisis Management Team, engaged its internal<br />
sourcing, planning and operations colleagues<br />
to deploy previously identified second sourcing<br />
options as well as to gain commitments from<br />
the supplier for additional capacity.<br />
Despite facing a natural disaster of huge<br />
proportions, Cisco was able to respond rapidly,<br />
ensure the safety of the extended supply<br />
chain, identify the risk exposure to the<br />
company and work with its EMS partners to mitigate the<br />
risk, thus ensuring no impact to customer shipments.<br />
The continuity planning, crisis management and risk<br />
mitigation arms of the SCRM team worked in close collaboration<br />
with internal partners in this endeavor.<br />
Quantifying the Impact<br />
Once the sites impacted by the earthquake in China were<br />
identified, we could quickly leverage and combine the<br />
BCP information with supply chain visibility data to determine<br />
any potential impact to Cisco’s customer shipments<br />
or financial bottom line by quantifying the exposure. The<br />
BCP data provides time-to-recovery data for each of the<br />
supply chain locations, including raw material suppliers,<br />
logistics and transportation providers, and<br />
EMS partners. This includes visibility into<br />
which components, materials or products<br />
are produced at each supplier locations. In<br />
addition, the supply chain data allows us to<br />
determine which products and how much<br />
revenue is enabled by each of the logistics<br />
and EMS partner locations.<br />
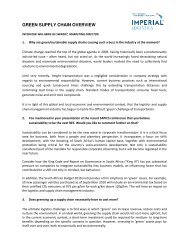
We are able to leverage these same analytical<br />
capabilities to develop supply chain<br />
risk assessments, helping Cisco focus on<br />
proactive risk mitigation programs with the<br />
right priorities. To accomplish this, Cisco<br />
uses a “risk engine” to assess the likelihood<br />
of a disruption. (See Exhibit 1.) The risk<br />
engine incorporates many data sets (such<br />
Inputs<br />
Disruptions<br />
Site/Component/Region<br />
Events & Frequency<br />
Supply Chain Impact<br />
(Site & Component)<br />
Time to Recover<br />
Expected Capacity Loss<br />
Supply Chain<br />
Redundancies<br />
Financial Impact<br />
Site/Region/Component<br />
Revenue<br />
Source: AMR Research<br />
Laredo<br />
EXHIBIT 1<br />
Risk Engine<br />
E2E Model<br />
• Simulation Engine<br />
• ~4300 Individual<br />
Input Parameters<br />
• Simulates 1000s<br />
of Scenarios<br />
Outputs<br />
Understanding<br />
Risk Drivers<br />
Understanding<br />
Geographical<br />
Concentration of Risk<br />
as 100-year flood data, actuary data, geological and geopolitical<br />
data, site incident data, supplier performance<br />
data) to assess the likelihood of a disruption. These disruptions<br />
are correlated to Cisco supply chain locations<br />
including supplier sites, contract manufacturing facilities<br />
and logistics centers. The impact of a disruption is determined<br />
based on the revenue enabled by each node in the<br />
supply chain and that node’s recovery time. Cisco also<br />
uses simulation capabilities to integrate all of these data<br />
sets into a single model that generates “heat maps” based<br />
on likelihood and impact. (Exhibit 2 depicts the mapping<br />
capabilities to assess supply chain nodes, which include<br />
suppliers, contract manufacturers, and strategic logistics<br />
centers, within the radius of an event.)<br />
EXHIBIT 2<br />
Mapping Capabilities to Assess Supply Chain Nodes<br />
San Angelo Waco<br />
Killeen Temple<br />
Mobile<br />
Round Rock<br />
Conroe<br />
Gulfport<br />
Bryan<br />
Lake Charles<br />
Austin<br />
TEXAS<br />
Houston<br />
LOUISIANA<br />
Beaumont<br />
Sugar Land<br />
New Orleans<br />
League City<br />
League City<br />
San Antonio<br />
Galveston<br />
Piedras<br />
Victoria<br />
Negras<br />
Corpus Christi<br />
Event<br />
14 Supply Chain Management Review · July/August 2009 www.scmr.com