Improved Immobiline⢠DryStrip gels and IPG Buffer - Acefesa.es
Improved Immobiline⢠DryStrip gels and IPG Buffer - Acefesa.es
Improved Immobiline⢠DryStrip gels and IPG Buffer - Acefesa.es

You also want an ePaper? Increase the reach of your titles
YUMPU automatically turns print PDFs into web optimized ePapers that Google loves.
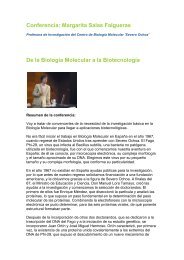
Basic pH area<br />
of Immobiline<br />
<strong>DryStrip</strong> pH<br />
3-11 NL<br />
A. Immobiline <strong>DryStrip</strong> pH 3-11 NL B. Immobiline <strong>DryStrip</strong> Strip pH 3-5.6<br />
C. Immobiline <strong>DryStrip</strong> pH 5.3-6.5 D. Immobiline <strong>DryStrip</strong> pH 6.2-7.5 E. Immobiline <strong>DryStrip</strong> pH 7-11 NL<br />
Fig 3. 2-D gel imag<strong>es</strong> using A) wide range Immobiline <strong>DryStrip</strong> pH 3-11NL or B-E) four overlapping narrow range <strong>IPG</strong> strips. Immobiline <strong>DryStrip</strong> pH 7-11 NL<br />
is able to r<strong>es</strong>olve a number of spots that were lost in the basic area of Immobiline <strong>DryStrip</strong> pH 3-11 NL.<br />
Higher r<strong>es</strong>olution using narrow range<br />
Immobiline <strong>DryStrip</strong> <strong>gels</strong><br />
To maximize r<strong>es</strong>olution, four overlapping narrow range <strong>IPG</strong><br />
strips were used <strong>and</strong> the spot maps were analyzed using<br />
ImageMaster 2D Platinum. The analysis was compared to<br />
data obtained using the wide range Immobiline <strong>DryStrip</strong> pH<br />
3-11 NL, <strong>and</strong> the analys<strong>es</strong> revealed a 200% increase of detected<br />
protein spots. Figure 3 shows the gel imag<strong>es</strong> from the narrow<br />
<strong>and</strong> wide range <strong>IPG</strong> strips. Figure 3E shows that Immobiline<br />
<strong>DryStrip</strong> pH 7-11 NL was able to r<strong>es</strong>olve several spots that<br />
were lost in the basic area of Immobiline <strong>DryStrip</strong> pH 3-11 NL.<br />
<strong>Improved</strong> <strong>IPG</strong> <strong>Buffer</strong> pH 3-10 <strong>and</strong><br />
pH 3-10 NL increas<strong>es</strong> r<strong>es</strong>olution<br />
<strong>IPG</strong> <strong>Buffer</strong> pH 3-10 <strong>and</strong> pH 3-10 NL have been improved with<br />
a new formula. The improved buffer formula was compared<br />
with the old formula based on the r<strong>es</strong>ulting 2-D spot maps.<br />
The quality of the <strong>gels</strong> was evaluated both by a panel of<br />
six experienced 2-D users <strong>and</strong> by software analysis using<br />
ImageMaster 2D Platinum. The panel evaluated several triplicate<br />
sets of 2-D spot maps using either improved <strong>IPG</strong> <strong>Buffer</strong> or<br />
previous <strong>IPG</strong> <strong>Buffer</strong> formulations, <strong>and</strong> based their evaluation<br />
on the numbers of spots, intensity, <strong>and</strong> focusing of the spots.<br />
Using ImageMaster 2D Platinum, the 2-D maps were evaluated<br />
based on spot intensity, spot matching, <strong>and</strong> spot numbers. The<br />
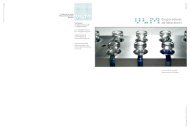
basic pH area of two 2-D spot maps is shown in Figure 4, while<br />
Figure 5 shows the complete 2-D spot maps. Both inv<strong>es</strong>tigation<br />
methods demonstrated that the improved buffers gave<br />
additional spots in the high molecular weight area <strong>and</strong> basic<br />
pH area of the gel, as well as spots with increased intensiti<strong>es</strong>.<br />
By increasing the intensity of low intensity spots, the probability<br />
of detecting low abundant proteins is increased. Note that<br />
the improved formula for <strong>IPG</strong> <strong>Buffer</strong> pH 3-10 <strong>and</strong> pH 3-10 NL<br />
giv<strong>es</strong> rise to a higher background in the basic pH area of the<br />
gel when using silver or Coomassie staining. This higher<br />
background can be avoided by prolonging the fixation time to<br />
3 hours or up to overnight if needed.<br />
Sample labeling: Lysed E.coli cells (50 µg) labeled with CyDye DIGE Fluor,<br />
Cy5 minimal dye<br />
Sample buffer: 8 M urea, 4% CHAPS, 40 mM DTT, <strong>and</strong> 2% <strong>IPG</strong> <strong>Buffer</strong><br />
pH 3-10 NL.<br />
First dimension IEF: Immobiline <strong>DryStrip</strong> <strong>gels</strong> (pH 3-10 NL; 18 cm) were<br />
rehydrated overnight at room temperature with<br />
D<strong>es</strong>treak Rehydration Solution <strong>and</strong> 0.5% <strong>IPG</strong> <strong>Buffer</strong> pH<br />
3-10 NL. The sample was applied by anodic cup loading<br />
<strong>and</strong> focused for 24 kVh.<br />
Second dimension: Run on Ettan DALTtwelve electrophor<strong>es</strong>is system<br />
using 12.5% labcast Laemmli <strong>gels</strong>.<br />
A. B.<br />
Fig 4. The basic area of 2-D protein spot maps using Immobiline <strong>DryStrip</strong> pH<br />
3-10 NL (18 cm) together with A) improved <strong>IPG</strong> <strong>Buffer</strong> pH 3-10 NL or B) the<br />
previous recipe for <strong>IPG</strong> <strong>Buffer</strong> pH 3-10 NL. The improved <strong>IPG</strong> <strong>Buffer</strong> formula<br />
r<strong>es</strong>ults in additional spots, <strong>and</strong> some of the differenc<strong>es</strong> are indicated in the figure.<br />
2 28-9488-45 AA