101 Years of Investment Returns - London Business School
101 Years of Investment Returns - London Business School
101 Years of Investment Returns - London Business School

You also want an ePaper? Increase the reach of your titles
YUMPU automatically turns print PDFs into web optimized ePapers that Google loves.
12<br />
Millennium Book II: <strong>101</strong> <strong>Years</strong> <strong>of</strong> <strong>Investment</strong> <strong>Returns</strong><br />
equity index was biased by the retrospective procedure used for index<br />
construction, as well as being affected by the start date <strong>of</strong> 1919.<br />
As the ABN AMRO/LBS index history extends back to 1900, we can now<br />
reassess the long-term returns that investors have achieved from the UK<br />
market. The full record <strong>of</strong> returns for 1900-1954, 1955-2000 and the entire<br />
<strong>101</strong>-year period is given in Table 2. The old Equity-Gilt Study numbers<br />
reported in Table 1 above indicated that equities gave a high annualised (ie,<br />
geometric mean) real return <strong>of</strong> 8.8 percent over the period 1919-54, very<br />
similar to the 8.2 percent reported in Table 2 below for the period since then.<br />
We noted above that the 8.8 percent figure for 1919-54 should really have<br />
been 6.4 percent after correcting for bias. But Table 2 shows that with a startdate<br />
<strong>of</strong> 1900, rather than 1919, the annualised real return was just 3.8 percent.<br />
Contrary to popular belief, real equity returns in the UK were much lower<br />
over the period 1900-54 than they have been subsequently.<br />
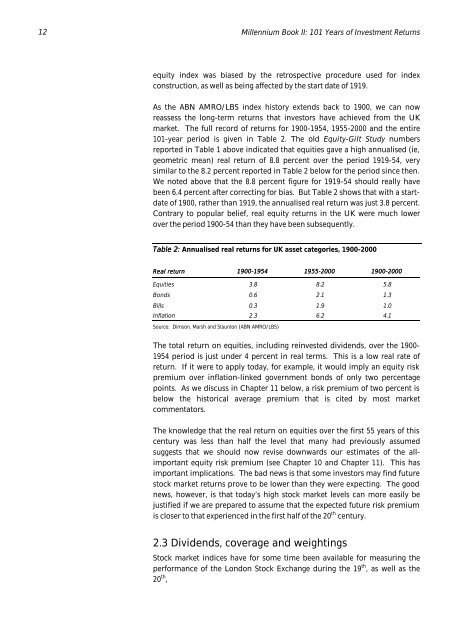
Table 2: Annualised real returns for UK asset categories, 1900-2000<br />
Real return 1900-1954 1900 1954 1955-2000 1955 2000 1900-2000 1900 2000<br />
Equities 3.8 8.2 5.8<br />
Bonds 0.6 2.1 1.3<br />
Bills 0.3 1.9 1.0<br />
Inflation 2.3 6.2 4.1<br />
Source: Dimson, Marsh and Staunton (ABN AMRO/LBS)<br />
The total return on equities, including reinvested dividends, over the 1900-<br />
1954 period is just under 4 percent in real terms. This is a low real rate <strong>of</strong><br />
return. If it were to apply today, for example, it would imply an equity risk<br />
premium over inflation-linked government bonds <strong>of</strong> only two percentage<br />
points. As we discuss in Chapter 11 below, a risk premium <strong>of</strong> two percent is<br />
below the historical average premium that is cited by most market<br />
commentators.<br />
The knowledge that the real return on equities over the first 55 years <strong>of</strong> this<br />
century was less than half the level that many had previously assumed<br />
suggests that we should now revise downwards our estimates <strong>of</strong> the allimportant<br />
equity risk premium (see Chapter 10 and Chapter 11). This has<br />
important implications. The bad news is that some investors may find future<br />
stock market returns prove to be lower than they were expecting. The good<br />
news, however, is that today’s high stock market levels can more easily be<br />
justified if we are prepared to assume that the expected future risk premium<br />
is closer to that experienced in the first half <strong>of</strong> the 20 th century.<br />
2.3 Dividends, coverage and weightings<br />
Stock market indices have for some time been available for measuring the<br />
performance <strong>of</strong> the <strong>London</strong> Stock Exchange during the 19 th , as well as the<br />
20 th ,