BRICs and Beyond - Goldman Sachs
BRICs and Beyond - Goldman Sachs
BRICs and Beyond - Goldman Sachs

Create successful ePaper yourself
Turn your PDF publications into a flip-book with our unique Google optimized e-Paper software.
Russia: A Smooth Political Transition<br />
Russia <strong>and</strong> the <strong>BRICs</strong> Projections<br />
Our well-known <strong>BRICs</strong> projections imply a<br />
rosy long-term future for Russia’s economy.<br />
Not only could it be the largest economy in<br />
Europe before the middle of this century<br />
but, alone among the <strong>BRICs</strong>, Russia has a<br />
real chance of catching up with living<br />
st<strong>and</strong>ards of the current G7, increasing its<br />
per capita GDP eleven-fold in constant<br />
Dollar terms between 2006 <strong>and</strong> 2050. We<br />
believe this is possible despite the dramatic<br />
projected population decline (from 142mn<br />
people to 109mn in 2050) <strong>and</strong> despite a<br />
steady decline in the average annual real<br />
GDP growth rate from 4.3% in 2006-2015<br />
to 1.5% between 2045 <strong>and</strong> 2050.<br />
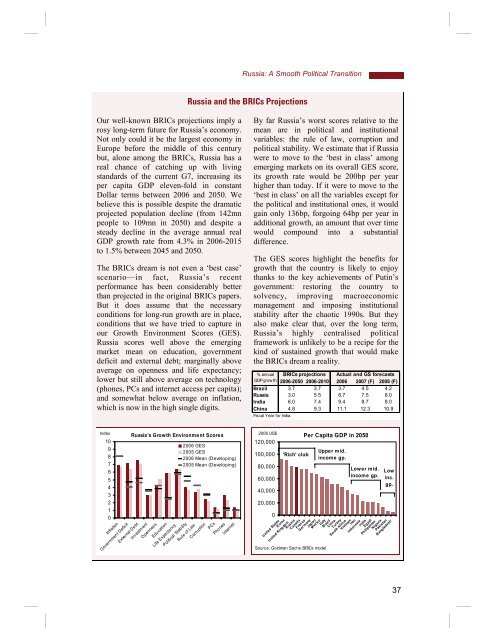
The <strong>BRICs</strong> dream is not even a ‘best case’<br />
scenario—in fact, Russia’s recent<br />
performance has been considerably better<br />
than projected in the original <strong>BRICs</strong> papers.<br />
But it does assume that the necessary<br />
conditions for long-run growth are in place,<br />
conditions that we have tried to capture in<br />
our Growth Environment Scores (GES).<br />
Russia scores well above the emerging<br />
market mean on education, government<br />
deficit <strong>and</strong> external debt; marginally above<br />
average on openness <strong>and</strong> life expectancy;<br />
lower but still above average on technology<br />
(phones, PCs <strong>and</strong> internet access per capita);<br />
<strong>and</strong> somewhat below average on inflation,<br />
which is now in the high single digits.<br />
By far Russia’s worst scores relative to the<br />
mean are in political <strong>and</strong> institutional<br />
variables: the rule of law, corruption <strong>and</strong><br />
political stability. We estimate that if Russia<br />
were to move to the ‘best in class’ among<br />
emerging markets on its overall GES score,<br />
its growth rate would be 200bp per year<br />
higher than today. If it were to move to the<br />
‘best in class’ on all the variables except for<br />
the political <strong>and</strong> institutional ones, it would<br />
gain only 136bp, forgoing 64bp per year in<br />
additional growth, an amount that over time<br />
would compound into a substantial<br />
difference.<br />
The GES scores highlight the benefits for<br />
growth that the country is likely to enjoy<br />
thanks to the key achievements of Putin’s<br />
government: restoring the country to<br />
solvency, improving macroeconomic<br />
management <strong>and</strong> imposing institutional<br />
stability after the chaotic 1990s. But they<br />
also make clear that, over the long term,<br />
Russia’s highly centralised political<br />
framework is unlikely to be a recipe for the<br />
kind of sustained growth that would make<br />
the <strong>BRICs</strong> dream a reality.<br />
% annual <strong>BRICs</strong> projections Actual <strong>and</strong> GS forecasts<br />
GDP grow th 2006-2050 2006-2010 2006 2007 (F) 2008 (F)<br />
Brazil 3.7 3.7 3.7 4.5 4.2<br />
Russia 3.0 5.5 6.7 7.5 8.0<br />
India 6.0 7.4 9.4 8.7 8.0<br />
China 4.8 9.3 11.1 12.3 10.9<br />
Fiscal Year for India.<br />
Index<br />
10<br />
9<br />
8<br />
7<br />
6<br />
5<br />
4<br />
3<br />
2<br />
1<br />
0<br />
Inflation<br />
Government Deficit<br />
Russia's Growth Environment Scores<br />
2006 GES<br />
2005 GES<br />
2006 Mean (Developing)<br />
2005 Mean (Developing)<br />
External Debt<br />
Investment<br />
Openness<br />
Edu cation<br />
Life Expectancy<br />
Political Stab ility<br />
Rule of Law<br />
Corruption<br />
PCs<br />
Pho nes<br />
Internet<br />
2006 US$<br />
120,000<br />
100,000<br />
80,000<br />
60,000<br />
40,000<br />
20,000<br />
0<br />
'Rich' club<br />
Source: <strong>Goldman</strong> <strong>Sachs</strong> <strong>BRICs</strong> model<br />
Per Capita GDP in 2050<br />
Upper mid.<br />
income gp.<br />
Lower mid.<br />
income gp.<br />
Low<br />
inc.<br />
gp.<br />
Bang ladesh<br />
United States<br />
Korea<br />
United Kingdom<br />
Russia<br />
Canada<br />
France<br />
Germany<br />
Japan<br />
Mexico<br />
Italy<br />
Brazil<br />
China<br />
Turkey<br />
South Africa<br />
Vietnam<br />
Iran<br />
Indonesia<br />
India<br />
Egypt<br />
Philippines<br />
Nigeria<br />
Pakistan<br />
37