chapter 3 chemical industry emissions - IPCC - Task Force on ...
chapter 3 chemical industry emissions - IPCC - Task Force on ...
chapter 3 chemical industry emissions - IPCC - Task Force on ...
Create successful ePaper yourself
Turn your PDF publications into a flip-book with our unique Google optimized e-Paper software.
Chapter 3: Chemical Industry Emissi<strong>on</strong>s<br />
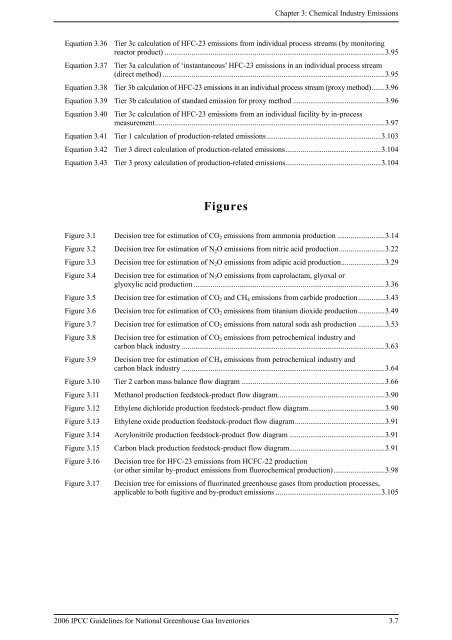
Equati<strong>on</strong> 3.36 Tier 3c calculati<strong>on</strong> of HFC-23 <str<strong>on</strong>g>emissi<strong>on</strong>s</str<strong>on</strong>g> from individual process streams (by m<strong>on</strong>itoring<br />
reactor product) ...................................................................................................................3.95<br />
Equati<strong>on</strong> 3.37 Tier 3a calculati<strong>on</strong> of ‘instantaneous’ HFC-23 <str<strong>on</strong>g>emissi<strong>on</strong>s</str<strong>on</strong>g> in an individual process stream<br />
(direct method) ....................................................................................................................3.95<br />
Equati<strong>on</strong> 3.38 Tier 3b calculati<strong>on</strong> of HFC-23 <str<strong>on</strong>g>emissi<strong>on</strong>s</str<strong>on</strong>g> in an individual process stream (proxy method).......3.96<br />
Equati<strong>on</strong> 3.39 Tier 3b calculati<strong>on</strong> of standard emissi<strong>on</strong> for proxy method ................................................3.96<br />
Equati<strong>on</strong> 3.40 Tier 3c calculati<strong>on</strong> of HFC-23 <str<strong>on</strong>g>emissi<strong>on</strong>s</str<strong>on</strong>g> from an individual facility by in-process<br />
measurement........................................................................................................................3.97<br />
Equati<strong>on</strong> 3.41 Tier 1 calculati<strong>on</strong> of producti<strong>on</strong>-related <str<strong>on</strong>g>emissi<strong>on</strong>s</str<strong>on</strong>g>............................................................3.103<br />
Equati<strong>on</strong> 3.42 Tier 3 direct calculati<strong>on</strong> of producti<strong>on</strong>-related <str<strong>on</strong>g>emissi<strong>on</strong>s</str<strong>on</strong>g>..................................................3.104<br />
Equati<strong>on</strong> 3.43 Tier 3 proxy calculati<strong>on</strong> of producti<strong>on</strong>-related <str<strong>on</strong>g>emissi<strong>on</strong>s</str<strong>on</strong>g>..................................................3.104<br />
Figures<br />
Figure 3.1 Decisi<strong>on</strong> tree for estimati<strong>on</strong> of CO 2 <str<strong>on</strong>g>emissi<strong>on</strong>s</str<strong>on</strong>g> from amm<strong>on</strong>ia producti<strong>on</strong> .........................3.14<br />
Figure 3.2 Decisi<strong>on</strong> tree for estimati<strong>on</strong> of N 2 O <str<strong>on</strong>g>emissi<strong>on</strong>s</str<strong>on</strong>g> from nitric acid producti<strong>on</strong>........................3.22<br />
Figure 3.3 Decisi<strong>on</strong> tree for estimati<strong>on</strong> of N 2 O <str<strong>on</strong>g>emissi<strong>on</strong>s</str<strong>on</strong>g> from adipic acid producti<strong>on</strong>.......................3.29<br />
Figure 3.4 Decisi<strong>on</strong> tree for estimati<strong>on</strong> of N 2 O <str<strong>on</strong>g>emissi<strong>on</strong>s</str<strong>on</strong>g> from caprolactam, glyoxal or<br />
glyoxylic acid producti<strong>on</strong> ....................................................................................................3.36<br />
Figure 3.5 Decisi<strong>on</strong> tree for estimati<strong>on</strong> of CO 2 and CH 4 <str<strong>on</strong>g>emissi<strong>on</strong>s</str<strong>on</strong>g> from carbide producti<strong>on</strong>..............3.43<br />
Figure 3.6 Decisi<strong>on</strong> tree for estimati<strong>on</strong> of CO 2 <str<strong>on</strong>g>emissi<strong>on</strong>s</str<strong>on</strong>g> from titanium dioxide producti<strong>on</strong>..............3.49<br />
Figure 3.7 Decisi<strong>on</strong> tree for estimati<strong>on</strong> of CO 2 <str<strong>on</strong>g>emissi<strong>on</strong>s</str<strong>on</strong>g> from natural soda ash producti<strong>on</strong> ..............3.53<br />
Figure 3.8 Decisi<strong>on</strong> tree for estimati<strong>on</strong> of CO 2 <str<strong>on</strong>g>emissi<strong>on</strong>s</str<strong>on</strong>g> from petro<str<strong>on</strong>g>chemical</str<strong>on</strong>g> <str<strong>on</strong>g>industry</str<strong>on</strong>g> and<br />
carb<strong>on</strong> black <str<strong>on</strong>g>industry</str<strong>on</strong>g> ..........................................................................................................3.63<br />
Figure 3.9 Decisi<strong>on</strong> tree for estimati<strong>on</strong> of CH 4 <str<strong>on</strong>g>emissi<strong>on</strong>s</str<strong>on</strong>g> from petro<str<strong>on</strong>g>chemical</str<strong>on</strong>g> <str<strong>on</strong>g>industry</str<strong>on</strong>g> and<br />
carb<strong>on</strong> black <str<strong>on</strong>g>industry</str<strong>on</strong>g> ..........................................................................................................3.64<br />
Figure 3.10 Tier 2 carb<strong>on</strong> mass balance flow diagram ...........................................................................3.66<br />
Figure 3.11 Methanol producti<strong>on</strong> feedstock-product flow diagram........................................................3.90<br />
Figure 3.12 Ethylene dichloride producti<strong>on</strong> feedstock-product flow diagram........................................3.90<br />
Figure 3.13 Ethylene oxide producti<strong>on</strong> feedstock-product flow diagram...............................................3.91<br />
Figure 3.14 Acryl<strong>on</strong>itrile producti<strong>on</strong> feedstock-product flow diagram ..................................................3.91<br />
Figure 3.15 Carb<strong>on</strong> black producti<strong>on</strong> feedstock-product flow diagram..................................................3.91<br />
Figure 3.16 Decisi<strong>on</strong> tree for HFC-23 <str<strong>on</strong>g>emissi<strong>on</strong>s</str<strong>on</strong>g> from HCFC-22 producti<strong>on</strong><br />
(or other similar by-product <str<strong>on</strong>g>emissi<strong>on</strong>s</str<strong>on</strong>g> from fluoro<str<strong>on</strong>g>chemical</str<strong>on</strong>g> producti<strong>on</strong>)...........................3.98<br />
Figure 3.17 Decisi<strong>on</strong> tree for <str<strong>on</strong>g>emissi<strong>on</strong>s</str<strong>on</strong>g> of fluorinated greenhouse gases from producti<strong>on</strong> processes,<br />
applicable to both fugitive and by-product <str<strong>on</strong>g>emissi<strong>on</strong>s</str<strong>on</strong>g> .......................................................3.105<br />
2006 <str<strong>on</strong>g>IPCC</str<strong>on</strong>g> Guidelines for Nati<strong>on</strong>al Greenhouse Gas Inventories 3.7


