Determination of 222 Rn Diffusion Coefficient in Japanese Soils
Determination of 222 Rn Diffusion Coefficient in Japanese Soils
Determination of 222 Rn Diffusion Coefficient in Japanese Soils

You also want an ePaper? Increase the reach of your titles
YUMPU automatically turns print PDFs into web optimized ePapers that Google loves.
P-1b-48<br />
This SRDM was calibrated <strong>in</strong> radon calibration facility <strong>of</strong> Nagoya University. The SRDM was<br />
put <strong>in</strong> the 247.8 L calibration chamber, and <strong>222</strong> <strong>Rn</strong> concentration was measured by ionization chamber<br />
made by Ohkura Electric Co. Japan.<br />
The sample used <strong>in</strong> this experiment come from different places <strong>in</strong> Japan with several porosities,<br />
water contents, densities, and 226 Ra concentration. The characteristics <strong>of</strong> soil was determ<strong>in</strong>ed us<strong>in</strong>g the<br />
standard procedures as described by M.Nakano (8).<br />
The sample to be exam<strong>in</strong>ed was packed <strong>in</strong> the sample plate A, and <strong>222</strong> <strong>Rn</strong> source was put <strong>in</strong> the<br />
compartment 1. Then the compartment 1 and compartment 2 were tightly closed. By the time, <strong>222</strong> <strong>Rn</strong> will<br />
grow <strong>in</strong> the compartment 1, and after that it will diffuse through the sample to the compartment 2. The<br />
concentrations <strong>of</strong> <strong>222</strong> <strong>Rn</strong> <strong>in</strong> both compartments were measured every 1 hour for about 3 to 4 weeks. The<br />
diffusion coefficient <strong>of</strong> <strong>222</strong> <strong>Rn</strong> <strong>in</strong> the soil was calculated by the equation 9.<br />
RESULTS AND ANALYSIS<br />
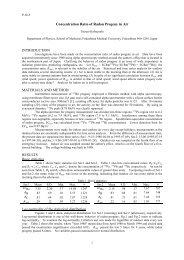
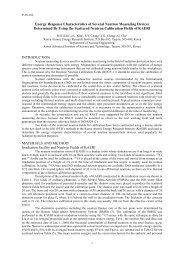
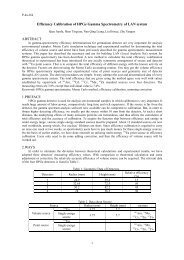
Each experiment gave a curve <strong>of</strong> <strong>222</strong> <strong>Rn</strong> growth <strong>in</strong> the SRDM as shown <strong>in</strong> Figure 3, for example.<br />
This curve shows the <strong>222</strong> <strong>Rn</strong> concentration <strong>in</strong> the compartment 1 conta<strong>in</strong>s the <strong>222</strong> <strong>Rn</strong> source and <strong>in</strong> the<br />
compartment 2. Also it is shown the ratio between compartment 1 and compartment 2, which it is as the<br />
first <strong>in</strong>dication for the calculation <strong>of</strong> diffusion coefficient.<br />
Radon concentration (Bqm-3)<br />
50000<br />
45000<br />
40000<br />
35000<br />
30000<br />
25000<br />
20000<br />
15000<br />
10000<br />
5000<br />
0<br />
1<br />
0,9<br />
0,8<br />
0,7<br />
0,6<br />
0,5<br />
0,4<br />
0,3<br />
0,2<br />
0,1<br />
0<br />
0 100 200 300 400 500<br />
T i m e (hour)<br />
ratio <strong>of</strong> compartment 1 and 2<br />
compartment2<br />
compartment 1<br />
Ratio <strong>of</strong><br />
comp.1/comp.2<br />
Figure 3 Radon growth <strong>of</strong> the Okayama Prefecture soil sample at SRDM.<br />
The values <strong>of</strong> <strong>222</strong> <strong>Rn</strong> diffusion coefficients calculated from each measurement are listed <strong>in</strong> Table<br />
1 along with the soil characteristics as porosity and water content. The q factor def<strong>in</strong>ed as D/D air also is<br />
shown (D air = 1.1x10 -5 m 2 s -1 (9)). The correlation between the diffusion coefficient and soil porosity<br />
and/or soil moisture is shown <strong>in</strong> Figure 4.<br />
4