Ethnic Specialization of Travel Agencies
Ethnic Specialization of Travel Agencies
Ethnic Specialization of Travel Agencies

Create successful ePaper yourself
Turn your PDF publications into a flip-book with our unique Google optimized e-Paper software.
Kons<br />
agencies supply to the airlines. Therefore, price is<br />
actually the commission level that the airlines are<br />
willing to <strong>of</strong>fer to the travel agencies. Also, consider<br />
the average costs <strong>of</strong> a specialized and non-specialized<br />
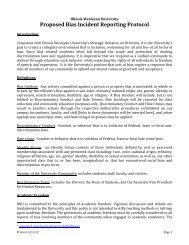
agency to be equivalent. Graph One shows the demand<br />
and supply curve for the entire general travel agency<br />
market at a commission level <strong>of</strong> ten percent, while<br />
so it is making a normal pr<strong>of</strong>it. At a commission level<br />
<strong>of</strong> ten percent, the general travel agency market is at<br />
equilibrium for a perfectly competitive market.<br />
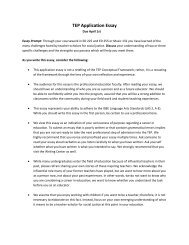
Now it is announced that the U.S. airlines have<br />
decided to cut the travel agents’ commissions down to<br />
eight percent. The airlines feel that they are less reliant<br />
on travel agencies to get passengers, so they reduce<br />
General <strong>Travel</strong> Agency at Equlibrium: Commission Level 10%<br />
Commission<br />
Level (price)<br />
Graph One: Market<br />
S<br />
Commission<br />
Level<br />
Graph Two: Individual Firm<br />
MC 1<br />
AC<br />
C 1<br />
c<br />
A<br />
1<br />
B<br />
DMR 1<br />
D<br />
Q 1<br />
Tickets for Airlines (quantity)<br />
Tickets for Airlines<br />
Shake-up in General <strong>Travel</strong> Agency Market: Commission Levels Change from 10% to 8%<br />
q 1<br />
MC 1<br />
AC<br />
Commission<br />
Level<br />
C 1<br />
C 2<br />
Graph Three: Market<br />
C<br />
A<br />
Q 2<br />
Q 1<br />
Tickets for Airlines<br />
Graph Four: Individual Firm<br />
S<br />
Commission<br />
Level<br />
12345678901234<br />
12345678901234<br />
c 1 R 12345678901234<br />
c 1<br />
B<br />
2 D<br />
D 2<br />
D 1<br />
q 1<br />
DMR 1<br />
DMR 2<br />
q 2<br />
Tickets for Airlines<br />
Graph Two shows the individual costs and revenue<br />
curves <strong>of</strong> a particular general travel agency. The<br />
equilibrium market commission level (C 1<br />
) and number<br />
<strong>of</strong> tickets supplied to the airlines (Q 1<br />
) is shown on<br />
Graph 1 at point A. Since this market is perfectly<br />
competitive, each travel agency is a price taker and<br />
must take the commission level at C 1<br />
, which again is<br />
ten percent. Therefore, the individual firms demand<br />
curve is DMR 1<br />
and commission level is c 1<br />
. Since an<br />
individual firm produces at the point where the<br />
marginal revenue curve (DMR 1<br />
) intersects the<br />
marginal cost curve (MC 1<br />
), the travel agency supplies<br />
the number tickets at q 1<br />
. At the commission and output<br />
level <strong>of</strong> B, the travel agency can cover its average costs,<br />
their commission or demand for travel agencies’<br />
services. Graph’s Three and Four demonstrate the<br />
effect that the decrease in commissions has on the<br />
general travel agency market. First the demand curve<br />
shifts from D 1<br />
to D 2<br />
, which shows the immediate effect<br />
<strong>of</strong> the change <strong>of</strong> commission level. As a result, the<br />
market’s new equilibrium point is now C. Therefore,<br />
the individual firm’s marginal revenue and demand<br />
curve shifts down from DMR 1<br />
to DMR 2<br />
on Graph Four<br />
as commission levels move from c 1<br />
to c 2<br />
. This new<br />
equilibrium point at point D does not allow the<br />
individual firm to cover its average costs, so the firm<br />
is no longer making a normal pr<strong>of</strong>it. The loss <strong>of</strong> pr<strong>of</strong>it<br />
is shown by Area R 1<br />
on Graph Four. Essentially, the<br />
The Park Place Economist / vol. VI