Plan Outlay and Expenditure
Plan Outlay and Expenditure
Plan Outlay and Expenditure

You also want an ePaper? Increase the reach of your titles
YUMPU automatically turns print PDFs into web optimized ePapers that Google loves.
C -1<br />
Ist<strong>Plan</strong> 2nd<br />
<strong>Plan</strong><br />
3rd<br />
<strong>Plan</strong><br />
Annual<br />
<strong>Plan</strong><br />
4th<br />
<strong>Plan</strong><br />
5th <strong>Plan</strong> Annual<br />
<strong>Plan</strong><br />
6th<br />
<strong>Plan</strong><br />
7th<br />
<strong>Plan</strong><br />
8th<br />
<strong>Plan</strong><br />
(Rs In Lakhs)<br />
9th<br />
<strong>Plan</strong><br />
Sl.No. Head of Development<br />
74-78&<br />
1951-56 1956-61 1961-66 1966-69 1969-74<br />
Annual<br />
<strong>Plan</strong>78-<br />
1979-80 1980-85 1985-90 1992-97 1997-2002<br />
79<br />
1 2 3 4 5 6 7 8 9 10 11 12 13<br />
Agricultural <strong>and</strong><br />
1<br />
Allied Services<br />
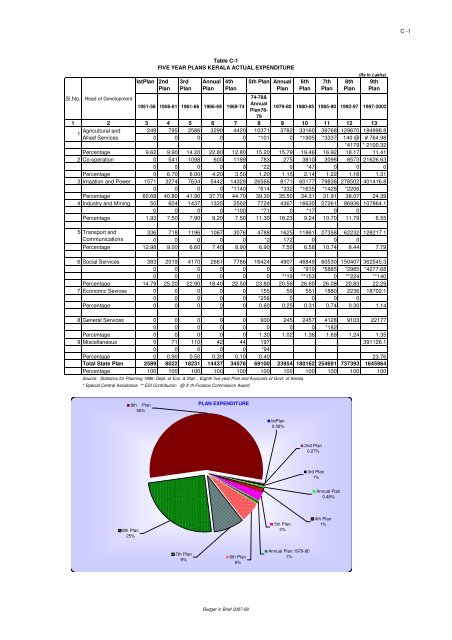
Table C-1<br />
FIVE YEAR PLANS KERALA ACTUAL EXPENDITURE<br />
249 795 2586 3290 4420 10371 3782 33160 39768 129670 184998.8<br />
0 0 0 0 0 *101 0 *1905 *3337 140 @ # 764.98<br />
*4179 * 2100.32<br />
Percentage 9.62 9.90 14.20 22.80 12.80 15.20 15.79 19.46 16.92 18.17 11.41<br />
2 Co-operation 0 541 1098 600 1199 783 275 3810 3096 8573 21626.63<br />
0 0 0 0 0 *22 0 *47 0 0 0<br />
Percentage 0 6.70 6.00 4.20 3.50 1.20 1.15 2.14 1.22 1.16 1.31<br />
3 Irrigation <strong>and</strong> Power 1571 3274 7634 5442 14329 26566 8171 60177 79838 278502 401416.8<br />
0 0 0 0 *1140 *614 *332 *1635 *1428 *2206<br />
Percentage 60.68 40.80 41.90 37.70 44.70 39.30 35.50 34.31 31.91 38.07 24.39<br />
4 Industry <strong>and</strong> Mining 50 604 1437 1335 2502 7724 4367 16630 27261 86936 107864.1<br />
0 0 0 0 *100 *71 0 *17 0 0<br />
Percentage 1.93 7.50 7.90 9.20 7.50 11.30 18.23 9.24 10.70 11.79 6.55<br />
5 Transport <strong>and</strong><br />
336 718 1196 1067 3076 4788 1625 11861 27358 62232 128217.1<br />
Communications 0 0 0 0 0 *2 172 0 0 0<br />
Percentage 12.98 9.00 6.60 7.40 8.90 6.90 7.50 6.58 10.74 8.44 7.79<br />
6 Social Services 383 2019 4170 2661 7766 16424 4907 46849 60530 150407 362545.3<br />
0 0 0 0 0 0 0 *910 *5885 *2985 *4277.68<br />
0 0 0 0 0 0 **19 **153 0 **224 **140<br />
Percentage 14.79 25.20 22.90 18.40 22.50 23.80 20.56 26.60 26.08 20.83 22.29<br />
7 Economic Sevices 0 0 0 0 0 155 59 551 1880 2236 18702.1<br />
0 0 0 0 0 *258 0 0 0 0<br />
Percentage 0 0 0 0 0 0.60 0.25 0.31 0.74 0.30 1.14<br />
8 General Services 0 0 0 0 0 930 245 2457 4128 9103 22177<br />
0 0 0 0 0 0 0 0 *182<br />
Percentage 0 0 0 0 0 1.30 1.02 1.36 1.69 1.24 1.35<br />
9 Miscellaneous 0 71 110 42 44 197 391126.1<br />
0 0 0 0 0 *94<br />
Percentage 0 0.90 0.50 0.30 0.10 0.40 23.76<br />
Total State <strong>Plan</strong> 2589 8022 18231 14437 34576 69100 23954 180162 254691 737393 1645964<br />
Percentage 100 100 100 100 100 100 100 100 100 100 100<br />
Source: Statistics for <strong>Plan</strong>ning 1986- Dept. of Eco. & Stat. , Eighth five year <strong>Plan</strong> <strong>and</strong> Accounts of Govt. of Kerala<br />
* Special Central Assistance ** ESI Contribution @ X th Finance Commission Award<br />
9th <strong>Plan</strong><br />
55%<br />
PLAN EXPENDITURE<br />
Ist<strong>Plan</strong><br />
0.09%<br />
2nd <strong>Plan</strong><br />
0.27%<br />
3rd <strong>Plan</strong><br />
1%<br />
Annual <strong>Plan</strong><br />
0.48%<br />
8th <strong>Plan</strong><br />
25%<br />
5th <strong>Plan</strong><br />
2%<br />
4th <strong>Plan</strong><br />
1%<br />
7th <strong>Plan</strong><br />
9%<br />
6th <strong>Plan</strong><br />
6%<br />
Annual <strong>Plan</strong> 1979-80<br />
1%<br />
Budget in Brief 2007-08