KMS State Report Card 2009-10 - Kettering City School District
KMS State Report Card 2009-10 - Kettering City School District
KMS State Report Card 2009-10 - Kettering City School District

You also want an ePaper? Increase the reach of your titles
YUMPU automatically turns print PDFs into web optimized ePapers that Google loves.
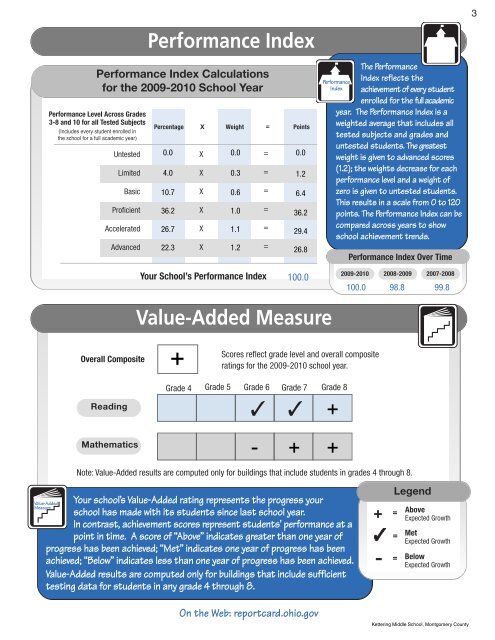
Performance Index<br />
Performance Index Calculations<br />
for the <strong>2009</strong>-20<strong>10</strong> <strong>School</strong> Year<br />
Performance Level Across Grades<br />
3-8 and <strong>10</strong> for all Tested Subjects<br />
(Includes every student enrolled in<br />
the school for a full academic year)<br />
Untested<br />
Limited<br />
Basic<br />
Proficient<br />
Accelerated<br />
Advanced<br />
Percentage<br />
0.0<br />
4.0<br />
<strong>10</strong>.7<br />
36.2<br />
26.7<br />
22.3<br />
X Weight =<br />
X<br />
X<br />
X<br />
X<br />
X<br />
X<br />
0.0<br />
0.3<br />
0.6<br />
1.0<br />
1.1<br />
1.2<br />
=<br />
=<br />
=<br />
=<br />
=<br />
=<br />
Points<br />
0.0<br />
1.2<br />
6.4<br />
36.2<br />
29.4<br />
26.8<br />
The Performance<br />
Index reflects the<br />
Performance<br />
Index achievement of every student<br />
enrolled for the fullacademic<br />
year. The Performance Index is a<br />
weighted average that includes all<br />
tested subjects and grades and<br />
untested students. The greatest<br />
weight is given to advanced scores<br />
(1.2); the weights decrease for each<br />
performance level and a weight of<br />
zero is given to untested students.<br />
This results in a scale from 0 to 120<br />
points. The Performance Index can be<br />
compared across years to show<br />
school achievement trends.<br />
Performance Index Over Time<br />
Performance Index Over Time<br />
3<br />
Your <strong>School</strong>’s Performance Index<br />
<strong>10</strong>0.0<br />
<strong>2009</strong>-20<strong>10</strong> 2008-<strong>2009</strong> 2007-2008<br />
<strong>10</strong>0.0 98.8 99.8<br />
Overall Composite<br />
Reading<br />
Value-Added Measure<br />
+<br />
Scores reflect grade level and overall composite<br />
ratings for the <strong>2009</strong>-20<strong>10</strong> school year.<br />
Grade 4 Grade 5 Grade 6 Grade 7 Grade 8<br />
+<br />
Value-Added<br />
Measure<br />
Mathematics<br />
- + +<br />
Your school’s Value-Added rating represents the progress your<br />
school has made with its students since last school year.<br />
In contrast, achievement scores represent students’ performance at a<br />
point in time. A score of “Above” indicates greater than one year of<br />
progress has been achieved; “Met” indicates one year of progress has been<br />
Value-Added<br />
Measure<br />
Note: Value-Added results are computed only for buildings that include students in grades 4 through 8.<br />
Value-Added results are computed only for buildings<br />
that include students in grades 4through 8.<br />
achieved; “Below” indicates less than one year of progress has been achieved.<br />
Value-Added results are computed only for buildings that include sufficient<br />
testing data for students in any grade 4 through 8.<br />
Above<br />
+ =<br />
Expected Growth<br />
-<br />
Legend<br />
=<br />
=<br />
Met<br />
Expected Growth<br />
Below<br />
Expected Growth<br />
On the Web: reportcard.ohio.gov<br />
On the Web: reportcard.ohio.gov<br />
<strong>Kettering</strong> Middle <strong>School</strong>, Montgomery County