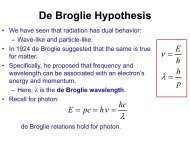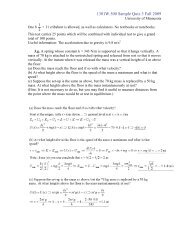
and v
and v
and v

Create successful ePaper yourself
Turn your PDF publications into a flip-book with our unique Google optimized e-Paper software.
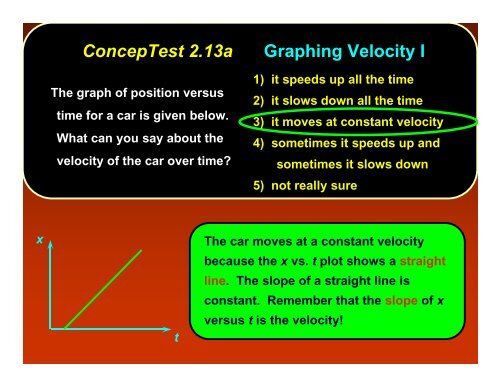
ConcepTest 2.13a Graphing Velocity I<br />
The graph of position versus<br />
time for a car is given below.<br />
What can you say about the<br />
velocity of the car over time?<br />
1) it speeds up all the time<br />
2) it slows down all the time<br />
3) it moves at constant velocity<br />
4) sometimes it speeds up <strong>and</strong><br />
sometimes it slows down<br />
5) not really sure<br />
x<br />
t<br />
The car moves at a constant velocity<br />
because the x vs. t plot shows a straight<br />
line. The slope of a straight line is<br />
constant. Remember that the slope of x<br />
versus t is the velocity!