Social background of MPs - Parliament
Social background of MPs - Parliament
Social background of MPs - Parliament

Create successful ePaper yourself
Turn your PDF publications into a flip-book with our unique Google optimized e-Paper software.
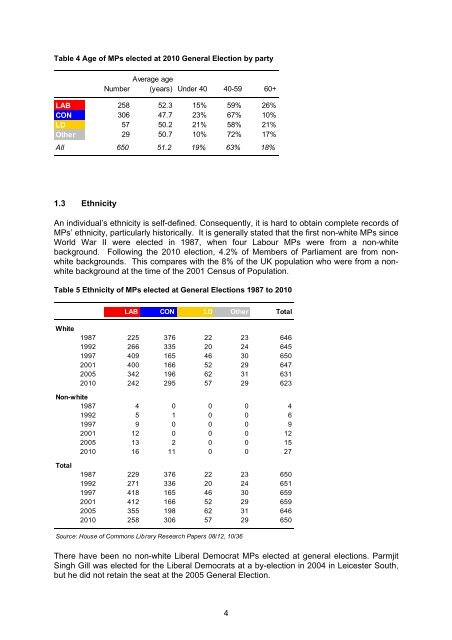
Table 4 Age <strong>of</strong> <strong>MPs</strong> elected at 2010 General Election by party<br />
Average age<br />
Number (years) Under 40 40-59 60+<br />
LAB 258 52.3 15% 59% 26%<br />
CON 306 47.7 23% 67% 10%<br />
LD 57 50.2 21% 58% 21%<br />
Other 29 50.7 10% 72% 17%<br />
All 650 51.2 19% 63% 18%<br />
1.3 Ethnicity<br />
An individual’s ethnicity is self-defined. Consequently, it is hard to obtain complete records <strong>of</strong><br />
<strong>MPs</strong>’ ethnicity, particularly historically. It is generally stated that the first non-white <strong>MPs</strong> since<br />
World War II were elected in 1987, when four Labour <strong>MPs</strong> were from a non-white<br />
<strong>background</strong>. Following the 2010 election, 4.2% <strong>of</strong> Members <strong>of</strong> <strong>Parliament</strong> are from nonwhite<br />
<strong>background</strong>s. This compares with the 8% <strong>of</strong> the UK population who were from a nonwhite<br />
<strong>background</strong> at the time <strong>of</strong> the 2001 Census <strong>of</strong> Population.<br />
Table 5 Ethnicity <strong>of</strong> <strong>MPs</strong> elected at General Elections 1987 to 2010<br />
LAB CON LD Other Total<br />
White<br />
1987 225 376 22 23 646<br />
1992 266 335 20 24 645<br />
1997 409 165 46 30 650<br />
2001 400 166 52 29 647<br />
2005 342 196 62 31 631<br />
2010 242 295 57 29 623<br />
Non-white<br />
1987 4 0 0 0<br />
4<br />
1992 5 1 0 0<br />
6<br />
1997 9 0 0 0<br />
9<br />
2001 12 0 0 0<br />
12<br />
2005 13 2 0 0<br />
15<br />
2010 16 11 0 0 27<br />
Total<br />
1987 229 376 22 23 650<br />
1992 271 336 20 24 651<br />
1997 418 165 46 30 659<br />
2001 412 166 52 29 659<br />
2005 355 198 62 31 646<br />
2010 258 306 57 29 650<br />
Source: House <strong>of</strong> Commons Library Research Papers 08/12, 10/36<br />
There have been no non-white Liberal Democrat <strong>MPs</strong> elected at general elections. Parmjit<br />
Singh Gill was elected for the Liberal Democrats at a by-election in 2004 in Leicester South,<br />
but he did not retain the seat at the 2005 General Election.<br />
4