reading skills and visual attention in school-age children
reading skills and visual attention in school-age children
reading skills and visual attention in school-age children

You also want an ePaper? Increase the reach of your titles
YUMPU automatically turns print PDFs into web optimized ePapers that Google loves.
0<br />
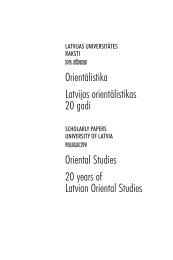
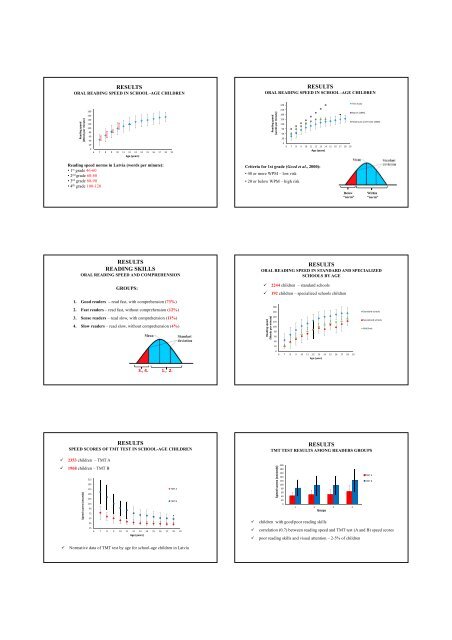
RESULTS<br />
ORAL READING SPEED IN SCHOOL -AGE CHILDREN<br />
RESULTS<br />
ORAL READING SPEED IN SCHOOL -AGE CHILDREN<br />
240<br />
This study<br />
Read<strong>in</strong>g speed<br />
(Words per m<strong>in</strong>ute)<br />
180<br />
160<br />
140<br />
120<br />
100<br />
80<br />
60<br />
40<br />
20<br />
6 7 8 9 10 11 12 13 14 15 16 17 18 19<br />
Age (years)<br />
Read<strong>in</strong>g speed<br />
(words per m<strong>in</strong>ute)<br />
210<br />
Starch (1995)<br />
180<br />
150<br />
Hasbrouck <strong>and</strong> T<strong>in</strong>dal (2005)<br />
120<br />
90<br />
60<br />
30<br />
0<br />
6 7 8 9 10 11 12 13 14 15 16 17 18 19<br />
Age (years)<br />
Read<strong>in</strong>g speed norms <strong>in</strong> Latvia (words per m<strong>in</strong>ute):<br />
• 1 st grade 46-60<br />
• 2 nd grade 60-80<br />
• 3 rd grade 80-90<br />
• 4 th grade 100-120<br />
Criteria for 1st grade (Good et al., 2000):<br />
• 40 or more WPM – low risk<br />
• 20 or below WPM – high risk<br />
Below<br />
“norm”<br />
With<strong>in</strong><br />
“norm”<br />
RESULTS<br />
READING SKILLS<br />
ORAL READING SPEED AND COMPREHENSION<br />
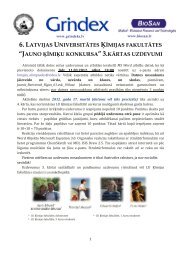
RESULTS<br />
ORAL READING SPEED IN STANDARD AND SPECIALIZED<br />
SCHOOLS BY AGE<br />
GROUPS:<br />
1. Good readers – read fast, with comprehension (73%)<br />
2. Fast readers – read fast, without comprehension (12%)<br />
3. Sense readers – read slow, with comprehension (11%)<br />
4. Slow readers – read slow, without comprehension (4%)<br />
2244 <strong>children</strong> – st<strong>and</strong>ard <strong>school</strong>s<br />
192 <strong>children</strong> – specialized <strong>school</strong>s <strong>children</strong><br />
Read<strong>in</strong>g speed<br />
(Words per m<strong>in</strong>ute)<br />
180<br />
160<br />
140<br />
120<br />
100<br />
80<br />
60<br />
40<br />
20<br />
0<br />
6 7 8 9 10 11 12 13 14 15 16 17 18 19<br />
Age (years)<br />
St<strong>and</strong>ard <strong>school</strong>s<br />
Specialized <strong>school</strong>s<br />
MIN limit<br />
3., 4. 1., 2.<br />
<br />
<br />
<br />
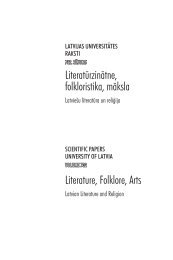
RESULTS<br />
SPEED SCORES OF TMT TEST IN SCHOOL-AGE CHILDREN<br />
2353 <strong>children</strong> – TMT A<br />
1968 <strong>children</strong> – TMT B<br />
Speed scores (seconds)<br />
215<br />
195<br />
175<br />
155<br />
135<br />
115<br />
95<br />
75<br />
55<br />
35<br />
15<br />
6 7 8 9 10 11 12 13 14 15 16 17 18 19<br />
Age (years)<br />
TMT A<br />
TMT B<br />
Normative data of TMT test by <strong>age</strong> for <strong>school</strong>-<strong>age</strong> <strong>children</strong> <strong>in</strong> Latvia<br />
RESULTS<br />
TMT TEST RESULTS AMONG READERS GROUPS<br />
Speed scores (seconds)<br />
200<br />
180<br />
160<br />
140<br />
120<br />
100<br />
80<br />
60<br />
40<br />
20<br />
0<br />
1 2 3 4<br />
Goups<br />
<strong>children</strong> with good/poor <strong>read<strong>in</strong>g</strong> <strong>skills</strong><br />
correlation (0.7) between <strong>read<strong>in</strong>g</strong> speed <strong>and</strong> TMT test (A <strong>and</strong> B) speed scores<br />
poor <strong>read<strong>in</strong>g</strong> <strong>skills</strong> <strong>and</strong> <strong>visual</strong> <strong>attention</strong> – 2-5% of <strong>children</strong><br />
TMT A<br />
TMT B