

OECD/NEA Benchmark Calculations for Accelerator Driven Systems
OECD/NEA Benchmark Calculations for Accelerator Driven Systems
OECD/NEA Benchmark Calculations for Accelerator Driven Systems

Create successful ePaper yourself
Turn your PDF publications into a flip-book with our unique Google optimized e-Paper software.
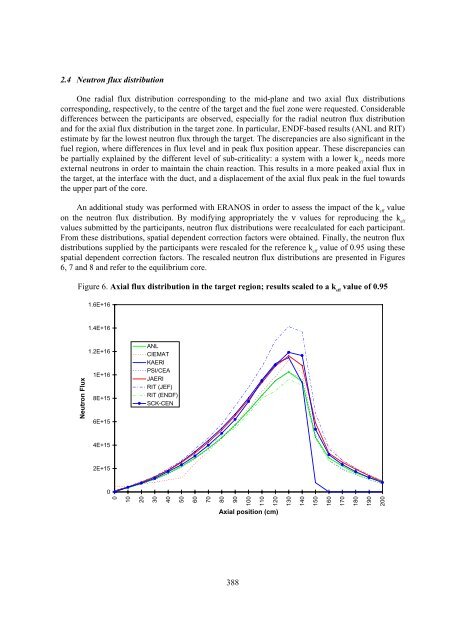
2.4 Neutron flux distribution<br />
One radial flux distribution corresponding to the mid-plane and two axial flux distributions<br />
corresponding, respectively, to the centre of the target and the fuel zone were requested. Considerable<br />
differences between the participants are observed, especially <strong>for</strong> the radial neutron flux distribution<br />
and <strong>for</strong> the axial flux distribution in the target zone. In particular, ENDF-based results (ANL and RIT)<br />
estimate by far the lowest neutron flux through the target. The discrepancies are also significant in the<br />
fuel region, where differences in flux level and in peak flux position appear. These discrepancies can<br />
be partially explained by the different level of sub-criticality: a system with a lower k eff<br />
needs more<br />
external neutrons in order to maintain the chain reaction. This results in a more peaked axial flux in<br />
the target, at the interface with the duct, and a displacement of the axial flux peak in the fuel towards<br />
the upper part of the core.<br />
An additional study was per<strong>for</strong>med with ERANOS in order to assess the impact of the k eff<br />
value<br />
on the neutron flux distribution. By modifying appropriately the ν values <strong>for</strong> reproducing the k eff<br />
values submitted by the participants, neutron flux distributions were recalculated <strong>for</strong> each participant.<br />
From these distributions, spatial dependent correction factors were obtained. Finally, the neutron flux<br />
distributions supplied by the participants were rescaled <strong>for</strong> the reference k eff<br />
value of 0.95 using these<br />
spatial dependent correction factors. The rescaled neutron flux distributions are presented in Figures<br />
6, 7 and 8 and refer to the equilibrium core.<br />
Figure 6. Axial flux distribution in the target region; results scaled to a k eff<br />
value of 0.95<br />
1.6E+16<br />
1.4E+16<br />
Neutron Flux<br />
1.2E+16<br />
1E+16<br />
8E+15<br />
6E+15<br />
ANL<br />
CIEMAT<br />
KAERI<br />
PSI/CEA<br />
JAERI<br />
RIT (JEF)<br />
RIT (ENDF)<br />
SCK-CEN<br />
4E+15<br />
2E+15<br />
0<br />
0<br />
10<br />
20<br />
30<br />
40<br />
50<br />
60<br />
70<br />
80<br />
90<br />
100<br />
110<br />
120<br />
130<br />
140<br />
150<br />
160<br />
170<br />
180<br />
190<br />
200<br />
Axial position (cm)<br />
388


