Investor Presentation - Oil India Limited
Investor Presentation - Oil India Limited
Investor Presentation - Oil India Limited

Create successful ePaper yourself
Turn your PDF publications into a flip-book with our unique Google optimized e-Paper software.
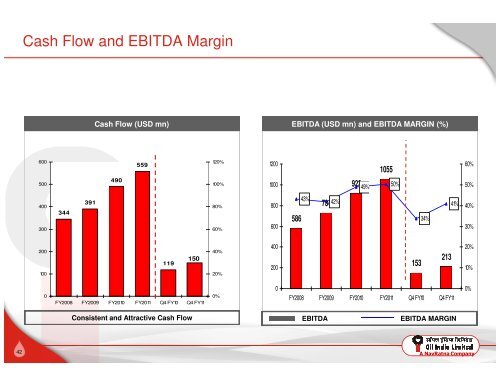
Cash Flow and EBITDA Margin<br />
Cash Flow (USD mn) EBITDA (USD mn) and EBITDA MARGIN (%)<br />
600<br />
559<br />
120%<br />
1200<br />
1055<br />
60%<br />
500<br />
490<br />
100%<br />
1000<br />
923<br />
49%<br />
50%<br />
50%<br />
400<br />
300<br />
344<br />
391<br />
80%<br />
60%<br />
800<br />
600<br />
586<br />
43%<br />
734<br />
42%<br />
34%<br />
41%<br />
40%<br />
30%<br />
200<br />
100<br />
119<br />
150<br />
40%<br />
20%<br />
400<br />
200<br />
153<br />
213<br />
20%<br />
10%<br />
0<br />
FY2008 FY2009 FY2010 FY2011 Q4 FY10 Q4 FY11<br />
0%<br />
0<br />
FY2008 FY2009 FY2010 FY2011 Q4 FY10 Q4 FY11<br />
0%<br />
Consistent and Attractive Cash Flow EBITDA EBITDA MARGIN<br />
42<br />
A NavRatna Company