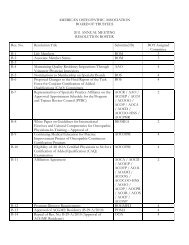
2011 Osteopathic Medical Profession Report - American ...
2011 Osteopathic Medical Profession Report - American ...
2011 Osteopathic Medical Profession Report - American ...

Create successful ePaper yourself
Turn your PDF publications into a flip-book with our unique Google optimized e-Paper software.
OMP <strong>Report</strong> <strong>2011</strong>-DOs<br />
<strong>Osteopathic</strong> Physician SPECIALTIES<br />
DO Distribution among <strong>Medical</strong> Specialties<br />
Due to an aging U.S. population and the overall decrease in medical school enrollment, the<br />
country is facing an impending primary care physician shortage. In some states, there are<br />
only 1.5 primary care physicians for every 1,000 residents. Historically, DOs have helped to<br />
bridge this gap – and they continue to do the same today. In <strong>2011</strong>, more than 60% of DOs<br />
are primary care physicians, meaning that they practice in any of the following specialties:<br />
general practice, family practice, pediatrics, internal medicine, and obstetrics/gynecology.<br />
Self-identified DO practice Specialties, 1984-<strong>2011</strong><br />
Family and<br />
general practice<br />
General internal<br />
medicine<br />
Pediatrics and<br />
adolescent<br />
medicine<br />
Obstetrics<br />
<strong>Osteopathic</strong><br />
manipulative<br />
medicine (OMM)<br />
or osteopathic<br />
manipulative<br />
treatment (OMT)<br />
specialties<br />
Other specialty<br />
Year DOs % DOs % DOs % DOs % DOs % DOs %<br />
<strong>2011</strong> 22,834 39.0 7,481 12.8 3,284 5.6 2,698 4.6 811 1.4 21,402 36.6<br />
2010 19,737 39.1 5,687 11.3 2,612 5.2 2,170 4.3 902 1.8 19,010 37.7<br />
2009 18,964 40.9 4,620 10.0 2,178 4.7 2,001 4.3 813 1.8 17,613 38.0<br />
2008 18,680 42.6 4171 9.5 1995 4.5 1,858 4.2 656 1.5 16,178 36.9<br />
2007 18,976 44.7 4,037 9.5 1,791 4.2 1,637 3.9 602 1.4 14,665 34.5<br />
2006 18,610 46.1 3,468 8.6 1,325 3.3 1,543 3.8 498 1.2 14,020 34.7<br />
2005 17,800 46.3 3,107 8.1 1,176 3.1 1,465 3.8 464 1.2 13,431 34.9<br />
2004 16,752 45.5 2,994 8.1 1,127 3.1 1,416 3.8 448 1.2 13,050 35.5<br />
1994 10,136 44.8 1,487 6.6 560 2.5 754 3.3 753 3.3 8,048 35.5<br />
1984 7,224 56.4 598 4.7 236 1.8 361 2.8 62 0.5 3,033 23.7<br />
NOTES/Sources: The table includes only DOs in active practice and out of postdoctoral training. All DOs who graduated after Jan. 1, 2007, are assumed to be in<br />
an internship or residency. The AOA Masterfile and data licensed from the Association of <strong>American</strong> <strong>Medical</strong> Colleges were used to identify DOs in residency programs.<br />
“Pediatrics and adolescent medicine” include all specialties where the patient is a child or an adolescent and includes both general pediatricians and pediatric<br />
specialities. The categories “Family and general practice” and “General internal medicine” do not include family physicians, general practitioners and general internists<br />
who also practice secondary specialties. Those osteopathic physicians are counted under “Other Specialty.” The category “OMT/OMM” includes family physicians<br />
who stress OMT in their practices in addition to osteopathic physicians who specialize in OMM. Board certifications were used when self-identified practice specialty<br />
was not available but this does not equate to the entire population of DOs.<br />
As of May 31, <strong>2011</strong>, Number of AOA Certifying Boards: 18<br />
Number of DOs Actively Board Certified by the AOA<br />
2006-07 2007-08 2008-09 2009-10 2010-11<br />
20,877 22,205 22,395 23,001 23,885<br />
8 | OSTEOPATHIC MEDICAL PROFESSION REPORT