Department of Education Annual Report 2009–10 - The Department ...
Department of Education Annual Report 2009–10 - The Department ...
Department of Education Annual Report 2009–10 - The Department ...

Create successful ePaper yourself
Turn your PDF publications into a flip-book with our unique Google optimized e-Paper software.
Overview <strong>of</strong> the <strong>Department</strong><br />
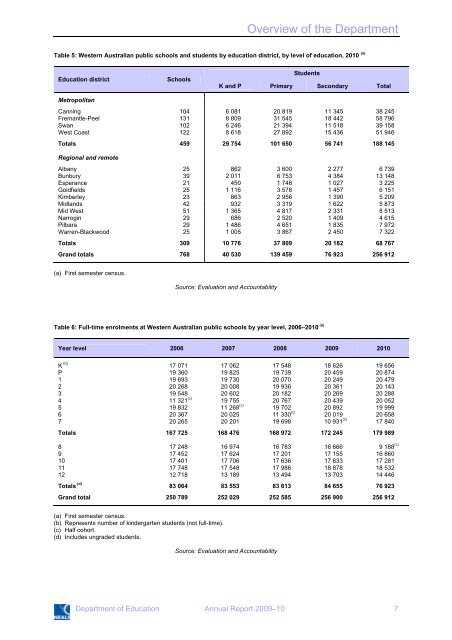
Table 5: Western Australian public schools and students by education district, by level <strong>of</strong> education, 2010 (a)<br />
<strong>Education</strong> district<br />
Metropolitan<br />
Schools<br />
Students<br />
K and P Primary Secondary Total<br />
Canning 104 6 081 20 819 11 345 38 245<br />
Fremantle-Peel 131 8 809 31 545 18 442 58 796<br />
Swan 102 6 246 21 394 11 518 39 158<br />
West Coast 122 8 618 27 892 15 436 51 946<br />
Totals 459 29 754 101 650 56 741 188 145<br />
Regional and remote<br />
Albany 25 862 3 600 2 277 6 739<br />
Bunbury 39 2 011 6 753 4 384 13 148<br />
Esperance 21 450 1 748 1 027 3 225<br />
Goldfields 25 1 116 3 578 1 457 6 151<br />
Kimberley 23 863 2 956 1 390 5 209<br />
Midlands 42 932 3 319 1 622 5 873<br />
Mid West 51 1 365 4 817 2 331 8 513<br />
Narrogin 29 686 2 520 1 409 4 615<br />
Pilbara 29 1 486 4 651 1 835 7 972<br />
Warren-Blackwood 25 1 005 3 867 2 450 7 322<br />
Totals 309 10 776 37 809 20 182 68 767<br />
Grand totals 768 40 530 139 459 76 923 256 912<br />
(a) First semester census.<br />
Source: Evaluation and Accountability<br />
Table 6: Full-time enrolments at Western Australian public schools by year level, 2006–2010 (a)<br />
Year level 2006 2007 2008 2009 2010<br />
K (b) 17 071 17 062 17 548 18 626 19 656<br />
P 19 360 19 825 19 739 20 459 20 874<br />
1 19 693 19 730 20 070 20 249 20 479<br />
2 20 268 20 008 19 936 20 361 20 143<br />
3 19 548 20 602 20 182 20 269 20 288<br />
4 11 321 (c) 19 755 20 767 20 439 20 052<br />
5 19 832 11 268 (c) 19 702 20 892 19 999<br />
6 20 367 20 025 11 330 (c) 20 019 20 658<br />
7 20 265 20 201 19 698 10 931 (c) 17 840<br />
Totals 167 725 168 476 168 972 172 245 179 989<br />
8 17 248 16 974 16 783 16 666 9 188 (c)<br />
9 17 452 17 624 17 201 17 155 16 860<br />
10 17 401 17 706 17 636 17 633 17 281<br />
11 17 748 17 548 17 986 18 878 18 532<br />
12 12 718 13 189 13 494 13 703 14 446<br />
Totals (d) 83 064 83 553 83 613 84 655 76 923<br />
Grand total 250 789 252 029 252 585 256 900 256 912<br />
(a) First semester census.<br />
(b) Represents number <strong>of</strong> kindergarten students (not full-time).<br />
(c) Half cohort.<br />
(d) Includes ungraded students.<br />
Source: Evaluation and Accountability<br />
<strong>Department</strong> <strong>of</strong> <strong>Education</strong> <strong>Annual</strong> <strong>Report</strong> <strong>2009–10</strong> 7