Welsh Castles Special - Penny Lane Striders
Welsh Castles Special - Penny Lane Striders
Welsh Castles Special - Penny Lane Striders

Create successful ePaper yourself
Turn your PDF publications into a flip-book with our unique Google optimized e-Paper software.
THE STRIDING REPORT | Issue 98 20<br />
Well we have had a prolific month with<br />
wide range of races completed ranging<br />
from 3km to 100 miles. With the addition<br />
of parkruns I already have to add new<br />
lines to my spreadsheet compared to last<br />
year and we are only 4 months into the<br />
season.<br />
Stato’s report<br />
by Andy Keeley<br />
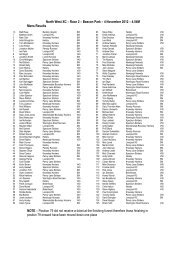
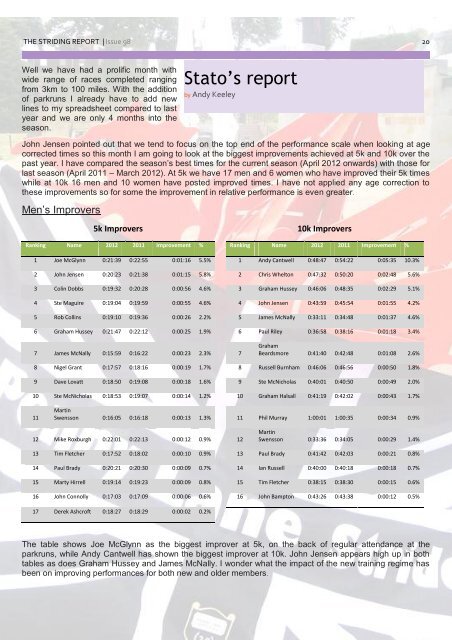
John Jensen pointed out that we tend to focus on the top end of the performance scale when looking at age<br />
corrected times so this month I am going to look at the biggest improvements achieved at 5k and 10k over the<br />
past year. I have compared the season’s best times for the current season (April 2012 onwards) with those for<br />
last season (April 2011 – March 2012). At 5k we have 17 men and 6 women who have improved their 5k times<br />
while at 10k 16 men and 10 women have posted improved times. I have not applied any age correction to<br />
these improvements so for some the improvement in relative performance is even greater.<br />
Men’s Improvers<br />
5k Improvers<br />
10k Improvers<br />
Ranking Name 2012 2011 Improvement % Ranking Name 2012 2011 Improvement %<br />
1 Joe McGlynn 0:21:39 0:22:55 0:01:16 5.5% 1 Andy Cantwell 0:48:47 0:54:22 0:05:35 10.3%<br />
2 John Jensen 0:20:23 0:21:38 0:01:15 5.8% 2 Chris Whelton 0:47:32 0:50:20 0:02:48 5.6%<br />
3 Colin Dobbs 0:19:32 0:20:28 0:00:56 4.6% 3 Graham Hussey 0:46:06 0:48:35 0:02:29 5.1%<br />
4 Ste Maguire 0:19:04 0:19:59 0:00:55 4.6% 4 John Jensen 0:43:59 0:45:54 0:01:55 4.2%<br />
5 Rob Collins 0:19:10 0:19:36 0:00:26 2.2% 5 James McNally 0:33:11 0:34:48 0:01:37 4.6%<br />
6 Graham Hussey 0:21:47 0:22:12 0:00:25 1.9% 6 Paul Riley 0:36:58 0:38:16 0:01:18 3.4%<br />
7 James McNally 0:15:59 0:16:22 0:00:23 2.3% 7<br />
Graham<br />
Beardsmore 0:41:40 0:42:48 0:01:08 2.6%<br />
8 Nigel Grant 0:17:57 0:18:16 0:00:19 1.7% 8 Russell Burnham 0:46:06 0:46:56 0:00:50 1.8%<br />
9 Dave Lovatt 0:18:50 0:19:08 0:00:18 1.6% 9 Ste McNicholas 0:40:01 0:40:50 0:00:49 2.0%<br />
10 Ste McNicholas 0:18:53 0:19:07 0:00:14 1.2% 10 Graham Halsall 0:41:19 0:42:02 0:00:43 1.7%<br />
11<br />
Martin<br />
Swensson 0:16:05 0:16:18 0:00:13 1.3% 11 Phil Murray 1:00:01 1:00:35 0:00:34 0.9%<br />
12 Mike Roxburgh 0:22:01 0:22:13 0:00:12 0.9% 12<br />
Martin<br />
Swensson 0:33:36 0:34:05 0:00:29 1.4%<br />
13 Tim Fletcher 0:17:52 0:18:02 0:00:10 0.9% 13 Paul Brady 0:41:42 0:42:03 0:00:21 0.8%<br />
14 Paul Brady 0:20:21 0:20:30 0:00:09 0.7% 14 Ian Russell 0:40:00 0:40:18 0:00:18 0.7%<br />
15 Marty Hirrell 0:19:14 0:19:23 0:00:09 0.8% 15 Tim Fletcher 0:38:15 0:38:30 0:00:15 0.6%<br />
16 John Connolly 0:17:03 0:17:09 0:00:06 0.6% 16 John Bampton 0:43:26 0:43:38 0:00:12 0.5%<br />
17 Derek Ashcroft 0:18:27 0:18:29 0:00:02 0.2%<br />
The table shows Joe McGlynn as the biggest improver at 5k, on the back of regular attendance at the<br />
parkruns, while Andy Cantwell has shown the biggest improver at 10k. John Jensen appears high up in both<br />
tables as does Graham Hussey and James McNally. I wonder what the impact of the new training regime has<br />
been on improving performances for both new and older members.