Read the Full Text (PDF) - Perfusion.com
Read the Full Text (PDF) - Perfusion.com
Read the Full Text (PDF) - Perfusion.com

You also want an ePaper? Increase the reach of your titles
YUMPU automatically turns print PDFs into web optimized ePapers that Google loves.
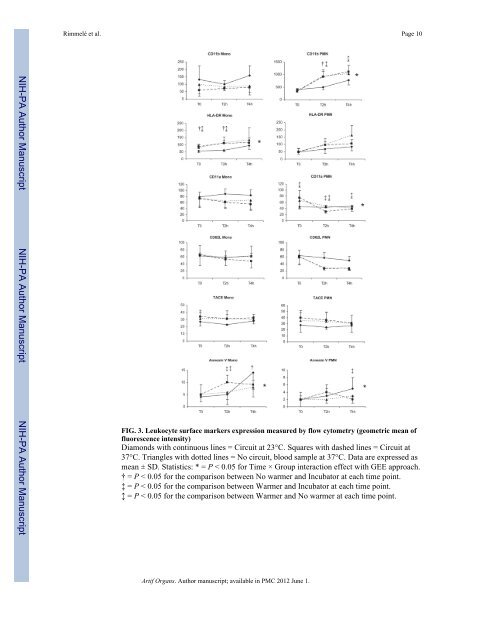
Rimmelé et al. Page 10<br />
NIH-PA Author Manuscript NIH-PA Author Manuscript NIH-PA Author Manuscript<br />
FIG. 3. Leukocyte surface markers expression measured by flow cytometry (geometric mean of<br />
fluorescence intensity)<br />
Diamonds with continuous lines = Circuit at 23°C. Squares with dashed lines = Circuit at<br />
37°C. Triangles with dotted lines = No circuit, blood sample at 37°C. Data are expressed as<br />
mean ± SD. Statistics: * = P < 0.05 for Time × Group interaction effect with GEE approach.<br />
† = P < 0.05 for <strong>the</strong> <strong>com</strong>parison between No warmer and Incubator at each time point.<br />
‡ = P < 0.05 for <strong>the</strong> <strong>com</strong>parison between Warmer and Incubator at each time point.<br />
↕ = P < 0.05 for <strong>the</strong> <strong>com</strong>parison between Warmer and No warmer at each time point.<br />
Artif Organs. Author manuscript; available in PMC 2012 June 1.