2413kb - Pinellas County Health Department
2413kb - Pinellas County Health Department
2413kb - Pinellas County Health Department

Create successful ePaper yourself
Turn your PDF publications into a flip-book with our unique Google optimized e-Paper software.
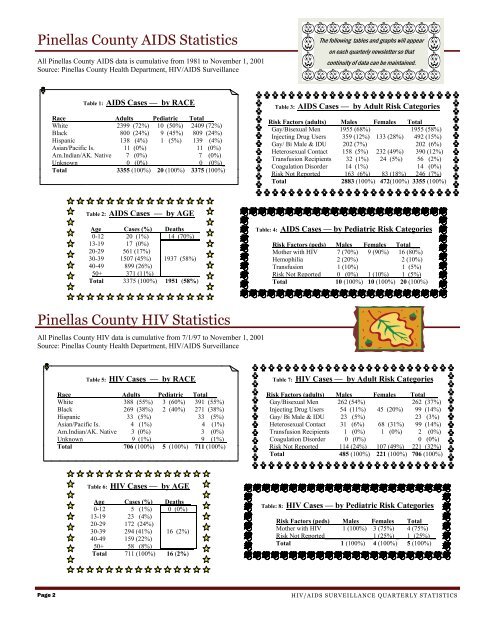
<strong>Pinellas</strong> <strong>County</strong> AIDS Statistics<br />
All <strong>Pinellas</strong> <strong>County</strong> AIDS data is cumulative from 1981 to November 1, 2001<br />
Source: <strong>Pinellas</strong> <strong>County</strong> <strong>Health</strong> <strong>Department</strong>, HIV/AIDS Surveillance<br />
The following tables and graphs will appear<br />
on each quarterly newsletter so that<br />
continuity of data can be maintained.<br />
Table 1: AIDS Cases — by RACE<br />
Race Adults Pediatric Total___<br />
White 2399 (72%) 10 (50%) 2409 (72%)<br />
Black 800 (24%) 9 (45%) 809 (24%)<br />
Hispanic 138 (4%) 1 (5%) 139 (4%)<br />
Asian/Pacific Is. 11 (0%) 11 (0%)<br />
Am.Indian/AK. Native 7 (0%) 7 (0%)<br />
Unknown 0 (0%) 0 (0%)_<br />
Total 3355 (100%) 20 (100%) 3375 (100%)<br />
Table 3: AIDS Cases — by Adult Risk Categories<br />
Risk Factors (adults) Males Females Total____<br />
Gay/Bisexual Men 1955 (68%) 1955 (58%)<br />
Injecting Drug Users 359 (12%) 133 (28%) 492 (15%)<br />
Gay/ Bi Male & IDU 202 (7%) 202 (6%)<br />
Heterosexual Contact 158 (5%) 232 (49%) 390 (12%)<br />
Transfusion Recipients 32 (1%) 24 (5%) 56 (2%)<br />
Coagulation Disorder 14 (1%) 14 (0%)<br />
Risk Not Reported 163 (6%) 83 (18%) 246 (7%)<br />
Total 2883 (100%) 472(100%) 3355 (100%)<br />
Table 2: AIDS Cases — by AGE<br />
Age Cases (%) Deaths__<br />
0-12 20 (1%) 14 (70%)<br />
13-19 17 (0%)<br />
20-29 561 (17%)<br />
30-39 1507 (45%) 1937 (58%)<br />
40-49 899 (26%)<br />
50+ 371 (11%) __ _<br />
Total 3375 (100%) 1951 (58%)<br />
Table: 4: AIDS Cases — by Pediatric Risk Categories<br />
Risk Factors (peds) Males Females Total___<br />
Mother with HIV 7 (70%) 9 (90%) 16 (80%)<br />
Hemophilia 2 (20%) 2 (10%)<br />
Transfusion 1 (10%) 1 (5%)<br />
Risk Not Reported 0 (0%) 1 (10%) 1 (5%)<br />
Total 10 (100%) 10 (100%) 20 (100%)<br />
<strong>Pinellas</strong> <strong>County</strong> HIV Statistics<br />
All <strong>Pinellas</strong> <strong>County</strong> HIV data is cumulative from 7/1/97 to November 1, 2001<br />
Source: <strong>Pinellas</strong> <strong>County</strong> <strong>Health</strong> <strong>Department</strong>, HIV/AIDS Surveillance<br />
Table 5: HIV Cases — by RACE<br />
Race Adults Pediatric Total___<br />
White 388 (55%) 3 (60%) 391 (55%)<br />
Black 269 (38%) 2 (40%) 271 (38%)<br />
Hispanic 33 (5%) 33 (5%)<br />
Asian/Pacific Is. 4 (1%) 4 (1%)<br />
Am.Indian/AK. Native 3 (0%) 3 (0%)<br />
Unknown 9 (1%) 9 (1%)_<br />
Total 706 (100%) 5 (100%) 711 (100%)<br />
Table 7: HIV Cases — by Adult Risk Categories<br />
Risk Factors (adults) Males Females Total____<br />
Gay/Bisexual Men 262 (54%) 262 (37%)<br />
Injecting Drug Users 54 (11%) 45 (20%) 99 (14%)<br />
Gay/ Bi Male & IDU 23 (5%) 23 (3%)<br />
Heterosexual Contact 31 (6%) 68 (31%) 99 (14%)<br />
Transfusion Recipients 1 (0%) 1 (0%) 2 (0%)<br />
Coagulation Disorder 0 (0%) 0 (0%)<br />
Risk Not Reported 114 (24%) 107 (49%) 221 (32%)<br />
Total 485 (100%) 221 (100%) 706 (100%)<br />
Table 6: HIV Cases — by AGE<br />
Age Cases (%) Deaths__<br />
0-12 5 (1%) 0 (0%)<br />
13-19 23 (4%)<br />
20-29 172 (24%)<br />
30-39 294 (41%) 16 (2%)<br />
40-49 159 (22%)<br />
50+ 58 (8%) _________<br />
Total 711 (100%) 16 (2%)<br />
Table: 8: HIV Cases — by Pediatric Risk Categories<br />
Risk Factors (peds) Males Females Total__<br />
Mother with HIV 1 (100%) 3 (75%) 4 (75%)<br />
Risk Not Reported_______________1 (25%) _ 1_(25%)__<br />
Total 1 (100%) 4 (100%) 5 (100%)<br />
Page 2<br />
HIV/AIDS SURVEILLANCE QUARTERLY STATISTICS