Bat Conservation and Management Workshop
Bat Conservation and Management Workshop
Bat Conservation and Management Workshop

You also want an ePaper? Increase the reach of your titles
YUMPU automatically turns print PDFs into web optimized ePapers that Google loves.
BCI <strong>Bat</strong> <strong>Conservation</strong> <strong>and</strong> <strong>Management</strong> <strong>Workshop</strong> – Arizona<br />
The reverse situation is well illustrated by data from<br />
the following exceptionally cold day. At 1250 on 29<br />
December 1976 the outside temperature was -6.1°C,<br />
<strong>and</strong> at 1935 the temperature had fallen to -8.2°C.<br />
Inside the cave at 1300 the air temperature at location<br />
A was fluctuating from -3.3 to -2.9°C, <strong>and</strong> the wall<br />
temperature was 0.8°C. At 1925 the air temperature at<br />
this site had continued to fall, varying from -4.7 to -<br />
4.5°C, <strong>and</strong> the wall temperature was -1.4°C. On this<br />
day continually falling outside temperature prevented<br />
the situation recorded on the previous day when<br />
inflowing air was warming the cave walls. On the<br />
second day incoming air ranged 2.1 to 3.3°C lower<br />
than wall temperature, as opposed to 1.9 to 2.2°C<br />
above wall temperature on the previous day. The first<br />
day‘s data are undoubtedly more representative of<br />
average daily cycles.<br />
Regardless of season or temperature of the inflowing air,<br />
relative humidity was lowest near the entrance where<br />
outside air entered. A gradient of increasing relative<br />
humidity existed between the places of entry <strong>and</strong> exit of<br />
the flow. Further, in caves with seasonally reversing air<br />
flow, passages that have low relative humidity at one<br />
season may have high relative humidity at another. These<br />
patterns are illustrated by our recordings from cave 2<br />
(Figure 2). On 10 January 1976 when air movement was<br />
past locations A, B, H, G, <strong>and</strong> E, in that order, sample<br />
relative humidities were as follows: B -- 49 percent;<br />
halfway between H <strong>and</strong> G -- 82 percent; halfway between<br />
G <strong>and</strong> E -- 86 percent; halfway between E <strong>and</strong> D (upper<br />
These data probably can explain the contradiction<br />
between our findings <strong>and</strong> those of several previous<br />
authors who claimed that wall temperatures in caves<br />
are normally about 1C lower than that of adjacent air<br />
masses (Twente, 1955; Nieuwenhoven, 1956, Hall,<br />
1962; McNab, 1974). These researchers limited their<br />
investigations to winter studies of hibernating bats.<br />
<strong>Bat</strong>s normally hibernate in caves whose structures act<br />
as cold air traps, <strong>and</strong> such caves tend to take in more<br />
<strong>and</strong> colder outside air at night than during the warmer<br />
days. By mid- or late morning, when researchers<br />
generally arrive at their caves, air flow often has<br />
slowed considerably <strong>and</strong> may have stopped altogether.<br />
Nevertheless, the last air drawn in was probably<br />
considerably warmer than the coldest night air,<br />
leading to the observation that air temperatures are<br />
generally higher than those of adjacent walls.<br />
RELATIONSHIP BETWEEN AIR MOVEMENT,<br />
TEMPERATURE, AND HUMIDITY<br />
A thorough study of cave humidity <strong>and</strong> the subtle<br />
interrelationships between humidity <strong>and</strong> the many<br />
factors that may bear upon it is far beyond the scope<br />
of our research. We did, however, make sporadic<br />
comparisons among humidity, temperature, <strong>and</strong> air<br />
movement in 10 of the caves investigated. Substrate<br />
type, ground moisture, <strong>and</strong> the presence of streams or<br />
st<strong>and</strong>ing water all contribute to basic cave humidity<br />
levels. Superimposed upon these basic factors, rates of<br />
air flow, nearness to a ―sucking‖ entrance <strong>and</strong> the<br />
humidity <strong>and</strong> temperature of air entering from outside<br />
compared to existing cave conditions were found to be<br />
of importance in determining daily <strong>and</strong> seasonal<br />
patterns of humidity.<br />
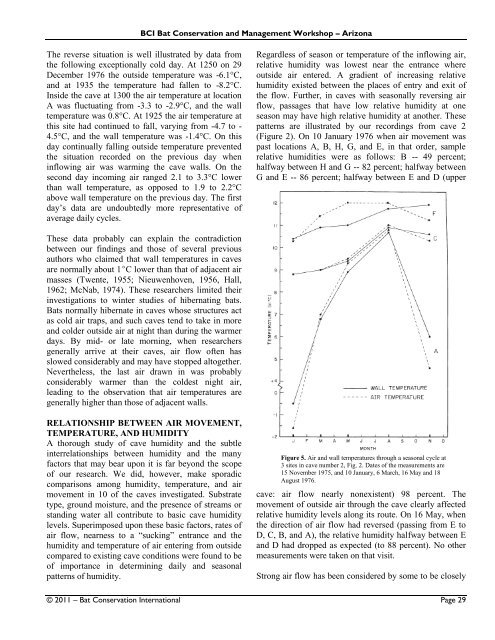
Figure 5. Air <strong>and</strong> wall temperatures through a seasonal cycle at<br />
3 sites in cave number 2, Fig. 2. Dates of the measurements are<br />
15 November 1975, <strong>and</strong> 10 January, 6 March, 16 May <strong>and</strong> 18<br />
August 1976.<br />
cave: air flow nearly nonexistent) 98 percent. The<br />
movement of outside air through the cave clearly affected<br />
relative humidity levels along its route. On 16 May, when<br />
the direction of air flow had reversed (passing from E to<br />
D, C, B, <strong>and</strong> A), the relative humidity halfway between E<br />
<strong>and</strong> D had dropped as expected (to 88 percent). No other<br />
measurements were taken on that visit.<br />
Strong air flow has been considered by some to be closely<br />
© 2011 – <strong>Bat</strong> <strong>Conservation</strong> International Page 29