

F&N Bulletin Vol 23 No 1b - United Nations University
F&N Bulletin Vol 23 No 1b - United Nations University
F&N Bulletin Vol 23 No 1b - United Nations University

You also want an ePaper? Increase the reach of your titles
YUMPU automatically turns print PDFs into web optimized ePapers that Google loves.
28<br />
tion in public schools, at the same time as nutrition<br />
education and physical activity programs to prevent<br />
increasing obesity in private schools are apparently<br />
called for.<br />
The study also showed a decreasing Z score in<br />
height-for-age and weight-for-age with age from 8<br />
to 10 years in both public and private schools. This<br />
trend was also reflected in the increasing prevalence<br />
of stunting and underweight with age from 8 to 10<br />
years, particularly in public schools. If this trend is real,<br />
it may have important programmatic implications.<br />
However, it may reflect, at least in part, the start of<br />
puberty and the influence of ethnicity affecting the<br />
significance of the differences from NCHS standards.<br />
As Flegal [9] pointed out, no valid comparisons in<br />
prevalence among age and sex groups may be made<br />
using statistical approaches in defining nutritional<br />
status, because variability among these groups may<br />
be constrained by the assumptions built into the<br />
cutoffs used. Thus, in contrast to public schoolchildren<br />
where thinness (BMI less than the 5th percentile)<br />
increased with age, thinness generally decreased with<br />
age among private schoolchildren. There is a need<br />
either to examine the reference standards for use in<br />
Filipino preadolescent and adolescent children or to<br />
validate the cutoff points used.<br />
Private schoolchildren had a greater relative change<br />
in height and weight Z scores from 8 to 10 years of<br />
age than public schoolchildren, resulting in a larger<br />
increase in BMI with age. The increase in BMI with<br />
age has also been noted among American children<br />
[8]. However, the increase should be interpreted with<br />
caution because of limitations of BMI as a measure<br />
of nutritional status in older schoolchildren due to<br />
changing body composition and degree of maturity<br />
with age and the influence of ethnicity.<br />
There was an increasing prevalence of underweight<br />
and stunting with age from 8 to 10 years, but a generally<br />
decreasing prevalence of overweight, in spite of<br />
the generally increasing BMI. However, further study<br />
is needed to determine whether these trends and differences<br />
are real and not due to reference standards<br />
and cutoff points.<br />
In order to compare weight-for-height index with<br />
BMI in assessing wasting/thinness and overweight,<br />
the same group of children was analyzed using both<br />
the WHO indices [6] and those of Troiano et al. [7].<br />
Children whose heights exceeded the limits of the<br />
NCHS/WHO weight-for-height table were excluded<br />
from the analysis. The results are shown in table 3 and<br />
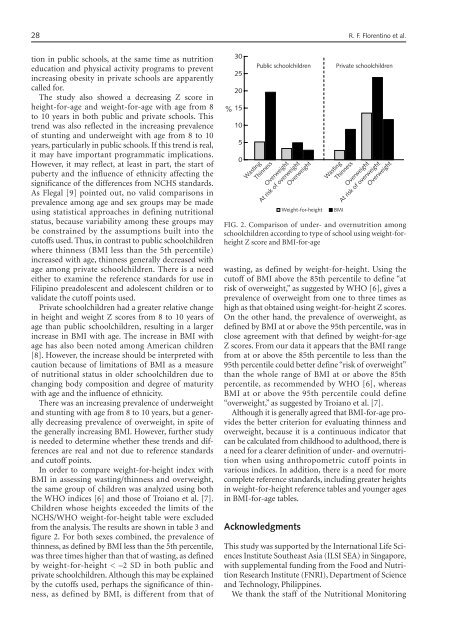
figure 2. For both sexes combined, the prevalence of<br />
thinness, as defined by BMI less than the 5th percentile,<br />
was three times higher than that of wasting, as defined<br />
by weight-for-height < –2 SD in both public and<br />
private schoolchildren. Although this may be explained<br />
by the cutoffs used, perhaps the significance of thinness,<br />
as defined by BMI, is different from that of<br />
30<br />
25<br />
20<br />
% 15<br />
10<br />
5<br />
0<br />
Public schoolchildren<br />
Wasting<br />
Thinness<br />
Overweight<br />
At risk of overweight<br />
Overweight<br />
FIG. 2. Comparison of under- and overnutrition among<br />
schoolchildren according to type of school using weight-forheight<br />
Z score and BMI-for-age<br />
wasting, as defined by weight-for-height. Using the<br />
cutoff of BMI above the 85th percentile to define “at<br />
risk of overweight,” as suggested by WHO [6], gives a<br />
prevalence of overweight from one to three times as<br />
high as that obtained using weight-for-height Z scores.<br />
On the other hand, the prevalence of overweight, as<br />
defined by BMI at or above the 95th percentile, was in<br />
close agreement with that defined by weight-for-age<br />
Z scores. From our data it appears that the BMI range<br />
from at or above the 85th percentile to less than the<br />
95th percentile could better define “risk of overweight”<br />
than the whole range of BMI at or above the 85th<br />
percentile, as recommended by WHO [6], whereas<br />
BMI at or above the 95th percentile could define<br />
“overweight,” as suggested by Troiano et al. [7].<br />
Although it is generally agreed that BMI-for-age provides<br />
the better criterion for evaluating thinness and<br />
overweight, because it is a continuous indicator that<br />
can be calculated from childhood to adulthood, there is<br />
a need for a clearer definition of under- and overnutrition<br />
when using anthropometric cutoff points in<br />
various indices. In addition, there is a need for more<br />
complete reference standards, including greater heights<br />
in weight-for-height reference tables and younger ages<br />
in BMI-for-age tables.<br />
Acknowledgments<br />
Weight-for-height<br />
Private schoolchildren<br />
Wasting<br />
Thinness<br />
Overweight<br />
At risk of overweight<br />
Overweight<br />
This study was supported by the International Life Sciences<br />
Institute Southeast Asia (ILSI SEA) in Singapore,<br />
with supplemental funding from the Food and Nutrition<br />
Research Institute (FNRI), Department of Science<br />
and Technology, Philippines.<br />
We thank the staff of the Nutritional Monitoring<br />
BMI<br />
R. F. Florentino et al.


