Chowdhury et al (2010); PDF file - Prolinnova
Chowdhury et al (2010); PDF file - Prolinnova
Chowdhury et al (2010); PDF file - Prolinnova

You also want an ePaper? Increase the reach of your titles
YUMPU automatically turns print PDFs into web optimized ePapers that Google loves.
Comparing Two Styles of Participatory Video 361<br />
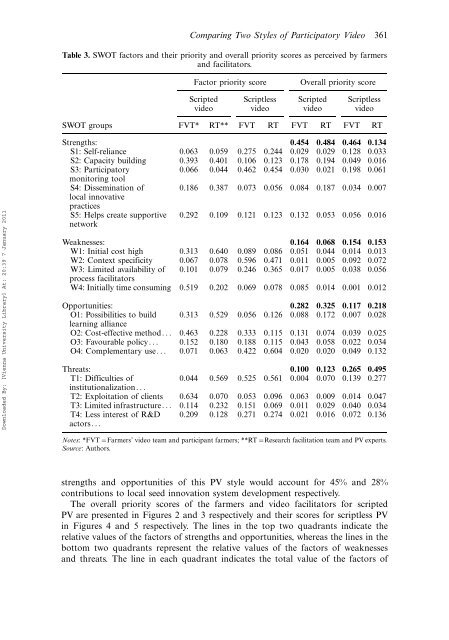
Table 3. SWOT factors and their priority and over<strong>al</strong>l priority scores as perceived by farmers<br />
and facilitators.<br />
Factor priority score<br />
Over<strong>al</strong>l priority score<br />
Scripted<br />
video<br />
Scriptless<br />
video<br />
Scripted<br />
video<br />
Scriptless<br />
video<br />
SWOT groups FVT* RT** FVT RT FVT RT FVT RT<br />
Downloaded By: [Vienna University Library] At: 20:39 7 January 2011<br />
Strengths: 0.454 0.484 0.464 0.134<br />
S1: Self-reliance 0.063 0.059 0.275 0.244 0.029 0.029 0.128 0.033<br />
S2: Capacity building 0.393 0.401 0.106 0.123 0.178 0.194 0.049 0.016<br />
S3: Participatory<br />
0.066 0.044 0.462 0.454 0.030 0.021 0.198 0.061<br />
monitoring tool<br />
S4: Dissemination of 0.186 0.387 0.073 0.056 0.084 0.187 0.034 0.007<br />
loc<strong>al</strong> innovative<br />
practices<br />
S5: Helps create supportive<br />
n<strong>et</strong>work<br />
0.292 0.109 0.121 0.123 0.132 0.053 0.056 0.016<br />
Weaknesses: 0.164 0.068 0.154 0.153<br />
W1: Initi<strong>al</strong> cost high 0.313 0.640 0.089 0.086 0.051 0.044 0.014 0.013<br />
W2: Context specificity 0.067 0.078 0.596 0.471 0.011 0.005 0.092 0.072<br />
W3: Limited availability of 0.101 0.079 0.246 0.365 0.017 0.005 0.038 0.056<br />
process facilitators<br />
W4: Initi<strong>al</strong>ly time consuming 0.519 0.202 0.069 0.078 0.085 0.014 0.001 0.012<br />
Opportunities: 0.282 0.325 0.117 0.218<br />
O1: Possibilities to build 0.313 0.529 0.056 0.126 0.088 0.172 0.007 0.028<br />
learning <strong>al</strong>liance<br />
O2: Cost-effective m<strong>et</strong>hod... 0.463 0.228 0.333 0.115 0.131 0.074 0.039 0.025<br />
O3: Favourable policy... 0.152 0.180 0.188 0.115 0.043 0.058 0.022 0.034<br />
O4: Complementary use... 0.071 0.063 0.422 0.604 0.020 0.020 0.049 0.132<br />
Threats: 0.100 0.123 0.265 0.495<br />
T1: Difficulties of<br />
0.044 0.569 0.525 0.561 0.004 0.070 0.139 0.277<br />
institution<strong>al</strong>ization...<br />
T2: Exploitation of clients 0.634 0.070 0.053 0.096 0.063 0.009 0.014 0.047<br />
T3: Limited infrastructure... 0.114 0.232 0.151 0.069 0.011 0.029 0.040 0.034<br />
T4: Less interest of R&D<br />
actors...<br />
0.209 0.128 0.271 0.274 0.021 0.016 0.072 0.136<br />
Notes: *FVTFarmers’ video team and participant farmers; **RTResearch facilitation team and PV experts.<br />
Source: Authors.<br />
strengths and opportunities of this PV style would account for 45% and 28%<br />
contributions to loc<strong>al</strong> seed innovation system development respectively.<br />
The over<strong>al</strong>l priority scores of the farmers and video facilitators for scripted<br />
PV are presented in Figures 2 and 3 respectively and their scores for scriptless PV<br />
in Figures 4 and 5 respectively. The lines in the top two quadrants indicate the<br />
relative v<strong>al</strong>ues of the factors of strengths and opportunities, whereas the lines in the<br />
bottom two quadrants represent the relative v<strong>al</strong>ues of the factors of weaknesses<br />
and threats. The line in each quadrant indicates the tot<strong>al</strong> v<strong>al</strong>ue of the factors of