2012 QCAT Year 9 Science â Student booklet - Queensland ...
2012 QCAT Year 9 Science â Student booklet - Queensland ...
2012 QCAT Year 9 Science â Student booklet - Queensland ...
Create successful ePaper yourself
Turn your PDF publications into a flip-book with our unique Google optimized e-Paper software.
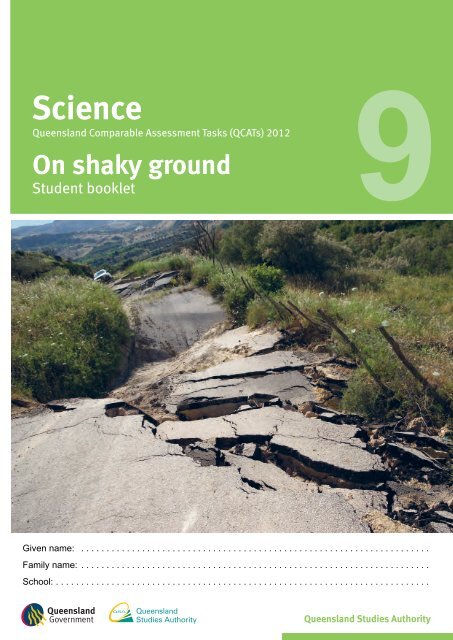
<strong>Science</strong><br />
<strong>Queensland</strong> Comparable Assessment Tasks (<strong>QCAT</strong>s) <strong>2012</strong><br />
On shaky ground<br />
<strong>Student</strong> <strong>booklet</strong><br />
9<br />
Given name: . . . . . . . . . . . . . . . . . . . . . . . . . . . . . . . . . . . . . . . . . . . . . . . . . . . . . . . . . . . . . . . . . . . . .<br />
Family name: . . . . . . . . . . . . . . . . . . . . . . . . . . . . . . . . . . . . . . . . . . . . . . . . . . . . . . . . . . . . . . . . . . . . .<br />
School: . . . . . . . . . . . . . . . . . . . . . . . . . . . . . . . . . . . . . . . . . . . . . . . . . . . . . . . . . . . . . . . . . . . . . . . . . .
Setting the scene<br />
Recent major earthquakes in Japan and New Zealand have shown that improving building design is a<br />
major factor in reducing damage and loss of life.<br />
Can we predict where dangerous earthquakes are likely to occur?<br />
Can we design buildings that won’t fall down when vibrated by earthquakes?<br />
These are questions that seismologists and engineers are working on, using scientific theory and<br />
modern technologies.<br />
Their tools of trade include:<br />
• data collected during earthquakes using technology including seismographs, lasers and GPS<br />
• the Theory of Plate Tectonics<br />
• modelling the effects of earthquakes on buildings.<br />
The development of buildings that can resist earthquake vibrations is largely based on studies of<br />
earthquakes such as the one that devastated Mexico City in 1985.<br />
© The State of <strong>Queensland</strong> (QSA) <strong>2012</strong> Please read our copyright notice .<br />
<strong>Queensland</strong> Studies Authority PO Box 307 Spring Hill Qld 4004<br />
Phone: (07) 3864 0299 Fax: (07) 3221 2533 Email: office@qsa.qld.edu.au Website: www.qsa.qld.edu.au<br />
Images p.1 Landslide: ; p. 3 Photo right, “total collapse”,<br />
p.14 “Hotel de Carlo” ; p. 3 Photo left, “Mexico City earthquake” .<br />
All other images © QSA.<br />
2 | <strong>QCAT</strong>s <strong>2012</strong> <strong>Student</strong> <strong>booklet</strong> <strong>Year</strong> 9 <strong>Science</strong>
Case study<br />
On 19 September 1985, an earthquake struck Mexico City. Over 10 000 people were killed<br />
and over 30 per cent of the buildings were completely destroyed. Studies of the damage to<br />
buildings revealed a pattern: most of the collapsed buildings were 8–15 stories high.<br />
Why did many of the taller and shorter buildings escape serious damage?<br />
In this assessment, you will:<br />
• model the effects of earthquake vibrations on buildings of different heights<br />
• use your understanding of plate tectonics to explain causes of earthquakes<br />
• analyse data to find earthquake location and magnitude<br />
• analyse patterns in seismic data to make predictions<br />
• use evidence and scientific concepts to explain patterns of building damage.<br />
<strong>Queensland</strong> Studies Authority<br />
| 3
How do earthquakes affect buildings of<br />
different heights?<br />
Investigation: Modelling the effect of earthquake vibrations on buildings of<br />
different heights<br />
In this model, the rulers represent the ground being shaken by the earthquake and the cardboard strips<br />
represent buildings.<br />
Diagram 1<br />
Cardboard strips held<br />
tightly between rulers.<br />
20 cm<br />
Four cardboard<br />
strips are held at<br />
top with paper clip.<br />
17.5 cm<br />
15 cm<br />
2 rulers<br />
rubber bands<br />
Slowly and gently<br />
vibrate this way.<br />
Method<br />
1. Very slowly and gently vibrate the rulers in the direction shown.<br />
2. Slowly increase the rate of vibration.<br />
* One vibration is<br />
3. When a strip begins to resonate (i.e. vibrate strongly and regularly),<br />
count the number of complete vibrations* in 10 seconds.<br />
a complete swing<br />
backwards and<br />
4. Record the result in the Trial 1 column for that strip.<br />
forwards.<br />
5. Continue to increase the rate of vibration, repeating steps 3 and 4.<br />
6. Repeat steps 1 to 5 until you have recorded the results of three trials for each strip.<br />
Table 1: Results<br />
Height of<br />
strip (cm)<br />
20.0<br />
17.5<br />
15.0<br />
Number of vibrations in 10 seconds<br />
Trial 1 Trial 2 Trial 3 Mean<br />
Frequency at which<br />
strip resonates<br />
(vibrations per second)<br />
Class discussion of results<br />
4 | <strong>QCAT</strong>s <strong>2012</strong> <strong>Student</strong> <strong>booklet</strong> <strong>Year</strong> 9 <strong>Science</strong>
Analysing the results<br />
Work on your own to complete the task.<br />
1. (a) Do the results support the following hypothesis?<br />
A strip of a certain height resonates at a particular frequency.<br />
• Yes<br />
• No<br />
(Circle one.)<br />
Explain your choice.<br />
. . . . . . . . . . . . . . . . . . . . . . . . . . . . . . . . . . . . . . . . . . . . . . . . . . . . . . . . . . . . . . . . . . . . . . . . . . . . . . . . .<br />
. . . . . . . . . . . . . . . . . . . . . . . . . . . . . . . . . . . . . . . . . . . . . . . . . . . . . . . . . . . . . . . . . . . . . . . . . . . . . . . . .<br />
. . . . . . . . . . . . . . . . . . . . . . . . . . . . . . . . . . . . . . . . . . . . . . . . . . . . . . . . . . . . . . . . . . . . . . . . . . . . . . . . .<br />
(b) Describe the relationship between the height of a strip and the frequency at which it<br />
resonates.<br />
. . . . . . . . . . . . . . . . . . . . . . . . . . . . . . . . . . . . . . . . . . . . . . . . . . . . . . . . . . . . . . . . . . . . . . . . . . . . . . . . .<br />
. . . . . . . . . . . . . . . . . . . . . . . . . . . . . . . . . . . . . . . . . . . . . . . . . . . . . . . . . . . . . . . . . . . . . . . . . . . . . . . . .<br />
(c) If a nearby earthquake produces rapid (high frequency) ground vibrations, which buildings are<br />
more likely to be damaged?<br />
• tall<br />
• medium<br />
• short<br />
(Circle one.)<br />
Explain your choice using the results of the investigation.<br />
. . . . . . . . . . . . . . . . . . . . . . . . . . . . . . . . . . . . . . . . . . . . . . . . . . . . . . . . . . . . . . . . . . . . . . . . . . . . . . . . .<br />
. . . . . . . . . . . . . . . . . . . . . . . . . . . . . . . . . . . . . . . . . . . . . . . . . . . . . . . . . . . . . . . . . . . . . . . . . . . . . . . . .<br />
. . . . . . . . . . . . . . . . . . . . . . . . . . . . . . . . . . . . . . . . . . . . . . . . . . . . . . . . . . . . . . . . . . . . . . . . . . . . . . . . .<br />
. . . . . . . . . . . . . . . . . . . . . . . . . . . . . . . . . . . . . . . . . . . . . . . . . . . . . . . . . . . . . . . . . . . . . . . . . . . . . . . . .<br />
<strong>Queensland</strong> Studies Authority<br />
| 5
In the model, the independent variable is height.<br />
Other variables may change the frequency at which a strip resonates,<br />
e.g. width, thickness, material (i.e. what it is made of).<br />
2. Choose a different independent variable that may change the frequency at which a strip<br />
resonates.<br />
. . . . . . . . . . . . . . . . . . . . . . . . . . . . . . . . . . . . . . . . . . . . . . . . . . . . . . . . . . . . . . . . . . . . . . . . . . . . . . . . . . . . .<br />
(a) How would the model be changed to test this variable? Include a diagram.<br />
. . . . . . . . . . . . . . . . . . . . . . . . . . . . . . . . . . . . . . . . . . . . . . . . . . . . . . . . . . . . . . . . . . . . . . . . . . . . . . . . .<br />
. . . . . . . . . . . . . . . . . . . . . . . . . . . . . . . . . . . . . . . . . . . . . . . . . . . . . . . . . . . . . . . . . . . . . . . . . . . . . . . . .<br />
. . . . . . . . . . . . . . . . . . . . . . . . . . . . . . . . . . . . . . . . . . . . . . . . . . . . . . . . . . . . . . . . . . . . . . . . . . . . . . . . .<br />
. . . . . . . . . . . . . . . . . . . . . . . . . . . . . . . . . . . . . . . . . . . . . . . . . . . . . . . . . . . . . . . . . . . . . . . . . . . . . . . . .<br />
. . . . . . . . . . . . . . . . . . . . . . . . . . . . . . . . . . . . . . . . . . . . . . . . . . . . . . . . . . . . . . . . . . . . . . . . . . . . . . . . .<br />
. . . . . . . . . . . . . . . . . . . . . . . . . . . . . . . . . . . . . . . . . . . . . . . . . . . . . . . . . . . . . . . . . . . . . . . . . . . . . . . . .<br />
Use this space for your diagram.<br />
(b) Write a hypothesis that you could test using the new model.<br />
If . . . . . . . . . . . . . . . . . . . . . . . . . . . . . . . . . . . . . . . . . . . . . . . . . . . . . . . . . . . . . . . . . . . . . . . . . . . . . . . .<br />
. . . . . . . . . . . . . . . . . . . . . . . . . . . . . . . . . . . . . . . . . . . . . . . . . . . . . . . . . . . . . . . . . . . . . . . . . . . . . . . . .<br />
then . . . . . . . . . . . . . . . . . . . . . . . . . . . . . . . . . . . . . . . . . . . . . . . . . . . . . . . . . . . . . . . . . . . . . . . . . . . . .<br />
. . . . . . . . . . . . . . . . . . . . . . . . . . . . . . . . . . . . . . . . . . . . . . . . . . . . . . . . . . . . . . . . . . . . . . . . . . . . . . . . .<br />
6 | <strong>QCAT</strong>s <strong>2012</strong> <strong>Student</strong> <strong>booklet</strong> <strong>Year</strong> 9 <strong>Science</strong>
What causes the ground to vibrate during<br />
an earthquake?<br />
3. Using the letters A–F, label Diagram 2 to show:<br />
A. crust<br />
B. mantle<br />
C. destructive plate boundary (crust being melted)<br />
The Theory of Plate Tectonics explains<br />
the origin of earthquakes, volcanoes<br />
and other geological activity.<br />
D. constructive plate boundary (new crust being formed)<br />
E. likely location of an earthquake<br />
F. likely location of a volcano.<br />
Diagram 2: Tectonic plates<br />
Pacific Ocean<br />
Cocos Plate<br />
x<br />
y<br />
Mexico<br />
Atlantic Ocean<br />
m n<br />
North American Plate African Plate<br />
Africa<br />
GPS measuring stations at m, n, x,<br />
y<br />
to measure plate movement.<br />
4. Complete Table 2 to predict how the distances between m and n, and between x and y, would<br />
change. Explain your predictions.<br />
Table 2<br />
Distance<br />
between …<br />
(See<br />
Diagram 2.)<br />
How the distance<br />
would change<br />
(Circle one.)<br />
Speed of<br />
change<br />
(Circle one.)<br />
Explanation<br />
(Using the Theory of Plate Tectonics)<br />
m and n<br />
(over many<br />
years)<br />
increases<br />
decreases<br />
stays the same<br />
slow<br />
rapid<br />
no change<br />
.......................................<br />
.......................................<br />
.......................................<br />
x and y<br />
(in the<br />
months<br />
before an<br />
earthquake)<br />
increases<br />
decreases<br />
stays the same<br />
slow<br />
rapid<br />
no change<br />
.......................................<br />
.......................................<br />
.......................................<br />
x and y<br />
(during an<br />
earthquake)<br />
increases<br />
decreases<br />
stays the same<br />
slow<br />
rapid<br />
no change<br />
.......................................<br />
.......................................<br />
.......................................<br />
<strong>Queensland</strong> Studies Authority<br />
| 7
Finding the epicentre and magnitude of<br />
an earthquake<br />
Use the information on pages 8 and 9 to answer Questions 5–9.<br />
Seismic waves<br />
The energy released by an earthquake is carried through the crustal rock<br />
as different types of waves.<br />
P (primary) waves travel faster than S (secondary) waves.<br />
When the waves arrive at the surface, they cause the ground to vibrate.<br />
Diagram 3 (a): Seismic waves<br />
seismograph<br />
station<br />
earthquake epicentre<br />
(the point on the surface above the focus)<br />
distance of<br />
station from<br />
epicentre<br />
seismograph<br />
station<br />
P waves<br />
S waves<br />
earthquake<br />
focus<br />
8 | <strong>QCAT</strong>s <strong>2012</strong> <strong>Student</strong> <strong>booklet</strong> <strong>Year</strong> 9 <strong>Science</strong>
When waves produced by an earthquake arrive at the surface, the vibrations<br />
are detected by a seismograph and recorded on a chart (a seismogram).<br />
Diagram 3 (b): A seismogram<br />
maximum<br />
amplitude (mm)<br />
Time (seconds)<br />
P wave<br />
arrival time<br />
S minus P ( S – P) time<br />
S wave<br />
arrival time<br />
Diagram 3 (c): Different frequencies of vibrations on a seismogram<br />
Low frequency<br />
vibrations<br />
High frequency<br />
vibrations<br />
<strong>Queensland</strong> Studies Authority<br />
| 9
Finding the epicentre and magnitude (size) of an earthquake helps<br />
seismologists to see patterns of building damage.<br />
Finding the epicentre and magnitude of the 1985 Mexican<br />
earthquake<br />
Below are two seismograms, each of which recorded vibrations from the earthquake that struck Mexico<br />
soon after 7:19 am on 19 September 1985.<br />
Seismogram 1: Mazatlan seismic station<br />
Amplitude (mm)<br />
500<br />
400<br />
300<br />
200<br />
100<br />
0<br />
100<br />
200<br />
arrival time<br />
300<br />
arrival time<br />
of first P wave<br />
of first S wave<br />
400<br />
S – P time<br />
500<br />
0 15 30 45 60 75 90 105 120 135 150 165 180 195 210 225 240<br />
Time (seconds) after 7:19 am<br />
Seismogram 2: Mexico City seismic station<br />
Amplitude (mm)<br />
500<br />
400<br />
300<br />
200<br />
100<br />
0<br />
100<br />
200<br />
300<br />
400<br />
500<br />
0 15 30 45 60 75 90 105 120 135 150 165 180 195 210 225 240<br />
Time (seconds) after 7:19 am<br />
5. Mark on Seismogram 2:<br />
• the arrival time of the first P wave and<br />
Note that the amplitude is greater than<br />
Seismogram 2 can display.<br />
• the arrival time of the first S wave.<br />
10 | <strong>QCAT</strong>s <strong>2012</strong> <strong>Student</strong> <strong>booklet</strong> <strong>Year</strong> 9 <strong>Science</strong>
6. (a) Find the time difference (S – P time) between the arrival of P and S waves at Mexico City<br />
seismic station (Seismogram 2).<br />
Seismic station<br />
S – P time<br />
Mazatlan<br />
85 sec<br />
Mexico City<br />
......... sec<br />
(b) Use Graph 1 below to find the distance of Mexico City seismic station from the epicentre.<br />
(The distance of Mazatlan from the epicentre is given as an example.)<br />
Graph 1: Conversion graph of S – P time to distance from epicentre<br />
1000<br />
900<br />
800<br />
Distance (km)<br />
700<br />
600<br />
500<br />
400<br />
300<br />
0 10 20 30 40 50 60 70 80 90 100 110<br />
S<br />
– P time (s)<br />
For example, the S – P time for<br />
Mazatlan seismic station is 85 seconds.<br />
Using the conversion graph, Mazatlan<br />
is 830 km from the epicentre.<br />
Seismic station<br />
Distance from<br />
epicentre<br />
Mazatlan<br />
830 km<br />
Mexico City<br />
......... km<br />
<strong>Queensland</strong> Studies Authority<br />
| 11
Map 1: Southern Mexico<br />
Mazatlan<br />
Cocos Plate<br />
North American Plate<br />
San Luis Potosi<br />
Plate boundary<br />
Mexico City<br />
0 200 400 600 800 1000<br />
km<br />
Map 1 above shows a circle with a radius of 830 km and Mazatlan at its centre.<br />
The epicentre of the 1985 earthquake lies somewhere on this circle.<br />
7. (a) Draw a circle with Mexico City at the centre and a radius equal to the distance of Mexico City<br />
from the epicentre (from Q6).<br />
(b) On Map 1, mark with a cross (X) the most likely epicentre of the earthquake.<br />
(c) Explain your choice using your understanding of plate tectonics.<br />
. . . . . . . . . . . . . . . . . . . . . . . . . . . . . . . . . . . . . . . . . . . . . . . . . . . . . . . . . . . . . . . . . . . . . . . . . . . . . . . . .<br />
. . . . . . . . . . . . . . . . . . . . . . . . . . . . . . . . . . . . . . . . . . . . . . . . . . . . . . . . . . . . . . . . . . . . . . . . . . . . . . . . .<br />
. . . . . . . . . . . . . . . . . . . . . . . . . . . . . . . . . . . . . . . . . . . . . . . . . . . . . . . . . . . . . . . . . . . . . . . . . . . . . . . . .<br />
. . . . . . . . . . . . . . . . . . . . . . . . . . . . . . . . . . . . . . . . . . . . . . . . . . . . . . . . . . . . . . . . . . . . . . . . . . . . . . . . .<br />
The magnitude of an earthquake<br />
(on the Richter scale) is found by<br />
measuring the maximum amplitude<br />
of S waves at a seismic station.<br />
Maximum<br />
amplitude (mm)<br />
8. (a) Use Seismogram 1 (page 10) to find the maximum amplitude of S waves at Mazatlan seismic<br />
station.<br />
Mazatlan seismic<br />
station<br />
Maximum amplitude of S waves<br />
......... mm<br />
Distance from epicentre<br />
830 km<br />
12 | <strong>QCAT</strong>s <strong>2012</strong> <strong>Student</strong> <strong>booklet</strong> <strong>Year</strong> 9 <strong>Science</strong>
Earthquake magnitude is determined by plotting amplitude and distance on a Richter nomogram.<br />
(b) Plot the data from question 8(a) on the Richter nomogram below. An example is given.<br />
Figure 1: The Richter nomogram<br />
900<br />
800<br />
700<br />
8.0<br />
500<br />
200<br />
600<br />
7.0<br />
100<br />
500<br />
400<br />
300<br />
200<br />
6.0<br />
5.0<br />
4.0<br />
50<br />
20<br />
10<br />
5<br />
2<br />
Using the Richter nomogram<br />
Example: When S waves have<br />
a maximum amplitude of 1 mm<br />
at a distance of 300 km, the<br />
magnitude is 4.0<br />
100<br />
3.0<br />
1<br />
60<br />
40<br />
30<br />
20<br />
Distance<br />
(km)<br />
2.0<br />
1.0<br />
Magnitude<br />
0.5<br />
0.2<br />
0.1<br />
Amplitude<br />
(mm)<br />
Magnitude of<br />
Mexican earthquake<br />
(on the Richter scale)<br />
= . .......<br />
Patterns in the seismic data<br />
San Luis Potosi is 580 km from the epicentre and does not have a seismic station.<br />
9. Sketch (below) the predicted seismogram for<br />
San Luis Potosi during the 1985 earthquake.<br />
Your answer should show the S – P time and<br />
estimates of amplitude and frequency.<br />
Look for patterns in the data by comparing<br />
Seismograms 1 and 2 on page 10.<br />
Seismogram 3: San Luis Potosi (580 km from epicentre)<br />
Amplitude (mm)<br />
500<br />
400<br />
300<br />
200<br />
100<br />
0<br />
100<br />
200<br />
300<br />
400<br />
500<br />
0 15 30 45 60 75 90 105 120 135 150 165 180 195 210 225 240<br />
arrival time<br />
of first P wave<br />
Time (seconds) after 7:19 am<br />
<strong>Queensland</strong> Studies Authority<br />
| 13
Explaining the pattern of building damage in<br />
Mexico City<br />
After determining the position and magnitude of the 1985 earthquake in Mexico, a seismologist said:<br />
Even though the 1985 earthquake was a strong quake, it was not very close to Mexico<br />
City. I was surprised that there was so much damage to buildings from 8 to 15 stories<br />
high, while many of the taller and shorter buildings were not damaged.<br />
This pattern of damage was not observed in locations closer to the epicentre.<br />
I found that Mexico City is built on clay that resonates at a particular frequency.<br />
I wonder if that has something to do with the pattern of building damage.<br />
10. Propose an explanation for the pattern of damage to buildings in Mexico City.<br />
Use the examples shown in the photo below.<br />
Justify your response with reference to:<br />
the seismologist’s statement above<br />
the frequency of ground vibrations at different distances from the epicentre<br />
the results of the modelling investigation on page 4<br />
similarities and differences between the buildings<br />
any other relevant information in this assessment task.<br />
14 | <strong>QCAT</strong>s <strong>2012</strong> <strong>Student</strong> <strong>booklet</strong> <strong>Year</strong> 9 <strong>Science</strong>
Use this space to plan your ideas. Use the list on page 14 as a checklist.<br />
. . . . . . . . . . . . . . . . . . . . . . . . . . . . . . . . . . . . . . . . . . . . . . . . . . . . . . . . . . . . . . . . . . . . . . . . . . . . . . . . . . . .<br />
. . . . . . . . . . . . . . . . . . . . . . . . . . . . . . . . . . . . . . . . . . . . . . . . . . . . . . . . . . . . . . . . . . . . . . . . . . . . . . . . . . . .<br />
. . . . . . . . . . . . . . . . . . . . . . . . . . . . . . . . . . . . . . . . . . . . . . . . . . . . . . . . . . . . . . . . . . . . . . . . . . . . . . . . . . . .<br />
. . . . . . . . . . . . . . . . . . . . . . . . . . . . . . . . . . . . . . . . . . . . . . . . . . . . . . . . . . . . . . . . . . . . . . . . . . . . . . . . . . . .<br />
. . . . . . . . . . . . . . . . . . . . . . . . . . . . . . . . . . . . . . . . . . . . . . . . . . . . . . . . . . . . . . . . . . . . . . . . . . . . . . . . . . . .<br />
. . . . . . . . . . . . . . . . . . . . . . . . . . . . . . . . . . . . . . . . . . . . . . . . . . . . . . . . . . . . . . . . . . . . . . . . . . . . . . . . . . . .<br />
. . . . . . . . . . . . . . . . . . . . . . . . . . . . . . . . . . . . . . . . . . . . . . . . . . . . . . . . . . . . . . . . . . . . . . . . . . . . . . . . . . . .<br />
. . . . . . . . . . . . . . . . . . . . . . . . . . . . . . . . . . . . . . . . . . . . . . . . . . . . . . . . . . . . . . . . . . . . . . . . . . . . . . . . . . . .<br />
. . . . . . . . . . . . . . . . . . . . . . . . . . . . . . . . . . . . . . . . . . . . . . . . . . . . . . . . . . . . . . . . . . . . . . . . . . . . . . . . . . . .<br />
. . . . . . . . . . . . . . . . . . . . . . . . . . . . . . . . . . . . . . . . . . . . . . . . . . . . . . . . . . . . . . . . . . . . . . . . . . . . . . . . . . . .<br />
. . . . . . . . . . . . . . . . . . . . . . . . . . . . . . . . . . . . . . . . . . . . . . . . . . . . . . . . . . . . . . . . . . . . . . . . . . . . . . . . . . . .<br />
. . . . . . . . . . . . . . . . . . . . . . . . . . . . . . . . . . . . . . . . . . . . . . . . . . . . . . . . . . . . . . . . . . . . . . . . . . . . . . . . . . . .<br />
. . . . . . . . . . . . . . . . . . . . . . . . . . . . . . . . . . . . . . . . . . . . . . . . . . . . . . . . . . . . . . . . . . . . . . . . . . . . . . . . . . . .<br />
. . . . . . . . . . . . . . . . . . . . . . . . . . . . . . . . . . . . . . . . . . . . . . . . . . . . . . . . . . . . . . . . . . . . . . . . . . . . . . . . . . . .<br />
. . . . . . . . . . . . . . . . . . . . . . . . . . . . . . . . . . . . . . . . . . . . . . . . . . . . . . . . . . . . . . . . . . . . . . . . . . . . . . . . . . . .<br />
. . . . . . . . . . . . . . . . . . . . . . . . . . . . . . . . . . . . . . . . . . . . . . . . . . . . . . . . . . . . . . . . . . . . . . . . . . . . . . . . . . . .<br />
<strong>Queensland</strong> Studies Authority<br />
| 15
Guide to making judgments <strong>Year</strong> 9 <strong>Science</strong> <strong>Student</strong> name . . . . . . . . . . . . . . . . . . . . . . . . . . . . . . . . . . . . . . . . . . . .<br />
Focus: To analyse data to draw conclusions and develop an evidence-based argument.<br />
Understanding Skills<br />
<strong>Science</strong> Understanding <strong>Science</strong> Inquiry Skills<br />
Identifies tectonic features and uses the Theory of Plate<br />
Tectonics to explain geological events.<br />
Questions 3, 4, 7b–c<br />
Analyses trends in experimental data to identify the relationship<br />
between two variables.<br />
Proposes modifications to an investigation and a testable<br />
hypothesis to improve the quality of evidence.<br />
Uses scientific concepts to analyse and present seismic data<br />
and draw conclusions.<br />
Questions 1, 2, 5, 6, 7a, 8<br />
Analyses patterns in seismic data to make predictions.<br />
Reviews evidence and scientific understandings to construct<br />
an evidence-based argument for the pattern of building<br />
damage.<br />
Questions 9, 10<br />
Uses appropriate scientific language, conventions and<br />
representations.<br />
Questions 1–10<br />
Identifies all tectonic features and uses the Theory of<br />
Plate Tectonics to provide well-reasoned explanations<br />
of crustal movements over time and the most likely<br />
location of the earthquake epicentre.<br />
Uses frequency data to explicitly support the given<br />
hypothesis. Clearly justifies which buildings are more<br />
likely to be affected by high frequency vibrations.<br />
Proposes a hypothesis that can be validly tested<br />
using the modifications suggested.<br />
Provides a detailed explanation for building damage,<br />
justified by a thorough analysis of all relevant evidence.<br />
Constructs a seismogram that reflects all patterns<br />
evident in the seismic data. Accurately interprets and<br />
presents data and makes clear, purposeful use of<br />
appropriate scientific language.<br />
A<br />
Suggests a set of valid modifications to the investigation.<br />
Analyses data to accurately determine the magnitude and<br />
possible epicentres of the earthquake.<br />
B<br />
Identifies most tectonic features. Correctly predicts<br />
some crustal movements over time. Uses the Theory<br />
of Plate Tectonics to explain a crustal movement or<br />
the most likely location of the earthquake epicentre.<br />
Uses data to partially explain the given hypothesis.<br />
Describes the relationship between height and frequency.<br />
Makes a valid prediction about which buildings are more<br />
likely to be affected by high frequency vibrations. Makes<br />
significant progress in determining magnitude and<br />
possible epicentres of the earthquake.<br />
Constructs a seismogram that reflects some of the<br />
patterns evident in the seismic data. Provides a partial<br />
explanation for building damage justified by some<br />
evidence. Makes appropriate use of scientific language,<br />
graphs and diagrams.<br />
C<br />
D<br />
Partially describes the relationship between height and<br />
frequency. Some success in determining magnitude<br />
and possible epicentres of the earthquake.<br />
Makes statements about building damage with some<br />
reference to information in the task. Uses some<br />
scientific terms.<br />
Identifies some crustal features.<br />
E<br />
Feedback: . . . . . . . . . . . . . . . . . . . . . . . . . . . . . . . . . . . . . . . . . . . . . . . . . . . . . . . . . . . . . . . . . . . . . . . . . . . . . . . . . . . . . . . . . . . . . . . . . . . . . . . . . . . . . . . . . . . . . . . . . . .<br />
. . . . . . . . . . . . . . . . . . . . . . . . . . . . . . . . . . . . . . . . . . . . . . . . . . . . . . . . . . . . . . . . . . . . . . . . . . . . . . . . . . . . . . . . . . . . . . . . . . . . . . . . . . . . . . . . . . . . . . . . . . . . . . . . . . . .


