Download the SABMiller plc 2006 Interim report PDF
Download the SABMiller plc 2006 Interim report PDF
Download the SABMiller plc 2006 Interim report PDF
You also want an ePaper? Increase the reach of your titles
YUMPU automatically turns print PDFs into web optimized ePapers that Google loves.
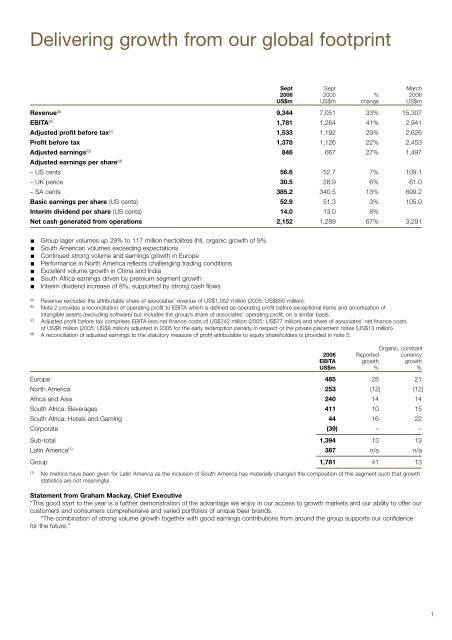
Delivering growth from our global footprint<br />
Sept Sept March<br />
<strong>2006</strong> 2005 % <strong>2006</strong><br />
US$m US$m change US$m<br />
Revenue (a) 9,344 7,051 33% 15,307<br />
EBITA (b) 1,781 1,264 41% 2,941<br />
Adjusted profit before tax (c) 1,533 1,192 29% 2,626<br />
Profit before tax 1,378 1,126 22% 2,453<br />
Adjusted earnings (d) 846 667 27% 1,497<br />
Adjusted earnings per share (d)<br />
– US cents 56.6 52.7 7% 109.1<br />
– UK pence 30.5 28.9 6% 61.0<br />
– SA cents 385.2 340.5 13% 699.2<br />
Basic earnings per share (US cents) 52.9 51.3 3% 105.0<br />
<strong>Interim</strong> dividend per share (US cents) 14.0 13.0 8%<br />
Net cash generated from operations 2,152 1,289 67% 3,291<br />
Group lager volumes up 29% to 117 million hectolitres (hl), organic growth of 9%<br />
South American volumes exceeding expectations<br />
Continued strong volume and earnings growth in Europe<br />
Performance in North America reflects challenging trading conditions<br />
Excellent volume growth in China and India<br />
South Africa earnings driven by premium segment growth<br />
<strong>Interim</strong> dividend increase of 8%, supported by strong cash flows<br />
(a)<br />
Revenue excludes <strong>the</strong> attributable share of associates’ revenue of US$1,052 million (2005: US$850 million).<br />
(b)<br />
Note 2 provides a reconciliation of operating profit to EBITA which is defined as operating profit before exceptional items and amortisation of<br />
intangible assets (excluding software) but includes <strong>the</strong> group’s share of associates’ operating profit, on a similar basis.<br />
(c)<br />
Adjusted profit before tax comprises EBITA less net finance costs of US$242 million (2005: US$77 million) and share of associates’ net finance costs<br />
of US$6 million (2005: US$8 million) adjusted in 2005 for <strong>the</strong> early redemption penalty in respect of <strong>the</strong> private placement notes (US$13 million).<br />
(d)<br />
A reconciliation of adjusted earnings to <strong>the</strong> statutory measure of profit attributable to equity shareholders is provided in note 5.<br />
Organic, constant<br />
<strong>2006</strong> Reported currency<br />
EBITA growth growth<br />
US$m % %<br />
Europe 485 28 21<br />
North America 253 (12) (12)<br />
Africa and Asia 240 14 14<br />
South Africa: Beverages 411 10 15<br />
South Africa: Hotels and Gaming 44 16 22<br />
Corporate (39) – –<br />
Sub-total 1,394 13 13<br />
Latin America (1) 387 n/a n/a<br />
Group 1,781 41 13<br />
(1)<br />
No metrics have been given for Latin America as <strong>the</strong> inclusion of South America has materially changed <strong>the</strong> composition of this segment such that growth<br />
statistics are not meaningful.<br />
Statement from Graham Mackay, Chief Executive<br />
“This good start to <strong>the</strong> year is a fur<strong>the</strong>r demonstration of <strong>the</strong> advantage we enjoy in our access to growth markets and our ability to offer our<br />
customers and consumers comprehensive and varied portfolios of unique beer brands.<br />
“The combination of strong volume growth toge<strong>the</strong>r with good earnings contributions from around <strong>the</strong> group supports our confidence<br />
for <strong>the</strong> future.”<br />
1


