Quality service of ISO 9000 consultants - Universitat de Girona
Quality service of ISO 9000 consultants - Universitat de Girona
Quality service of ISO 9000 consultants - Universitat de Girona

Create successful ePaper yourself
Turn your PDF publications into a flip-book with our unique Google optimized e-Paper software.
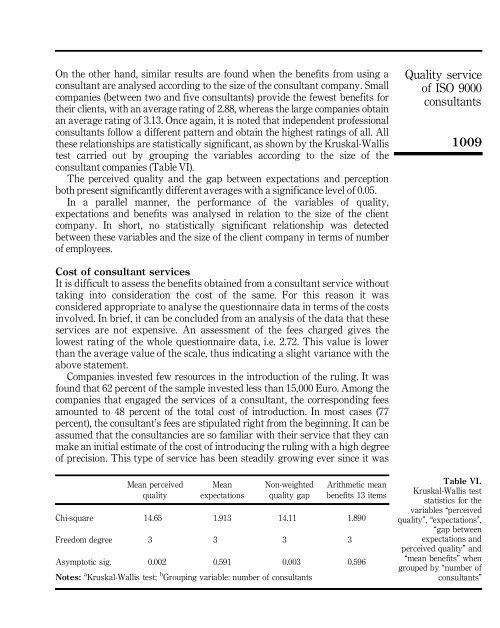
On the other hand, similar results are found when the benefits from using a<br />
consultant are analysed according to the size <strong>of</strong> the consultant company. Small<br />
companies (between two and five <strong>consultants</strong>) provi<strong>de</strong> the fewest benefits for<br />
their clients, with an average rating <strong>of</strong> 2.88, whereas the large companies obtain<br />
an average rating <strong>of</strong> 3.13. Once again, it is noted that in<strong>de</strong>pen<strong>de</strong>nt pr<strong>of</strong>essional<br />
<strong>consultants</strong> follow a different pattern and obtain the highest ratings <strong>of</strong> all. All<br />
these relationships are statistically significant, as shown by the Kruskal-Wallis<br />
test carried out by grouping the variables according to the size <strong>of</strong> the<br />
consultant companies (Table VI).<br />
The perceived quality and the gap between expectations and perception<br />
both present significantly different averages with a significance level <strong>of</strong> 0.05.<br />
In a parallel manner, the performance <strong>of</strong> the variables <strong>of</strong> quality,<br />
expectations and benefits was analysed in relation to the size <strong>of</strong> the client<br />
company. In short, no statistically significant relationship was <strong>de</strong>tected<br />
between these variables and the size <strong>of</strong> the client company in terms <strong>of</strong> number<br />
<strong>of</strong> employees.<br />
<strong>Quality</strong> <strong>service</strong><br />
<strong>of</strong> <strong>ISO</strong> <strong>9000</strong><br />
<strong>consultants</strong><br />
1009<br />
Cost <strong>of</strong> consultant <strong>service</strong>s<br />
It is difficult to assess the benefits obtained from a consultant <strong>service</strong> without<br />
taking into consi<strong>de</strong>ration the cost <strong>of</strong> the same. For this reason it was<br />
consi<strong>de</strong>red appropriate to analyse the questionnaire data in terms <strong>of</strong> the costs<br />
involved. In brief, it can be conclu<strong>de</strong>d from an analysis <strong>of</strong> the data that these<br />
<strong>service</strong>s are not expensive. An assessment <strong>of</strong> the fees charged gives the<br />
lowest rating <strong>of</strong> the whole questionnaire data, i.e. 2.72. This value is lower<br />
than the average value <strong>of</strong> the scale, thus indicating a slight variance with the<br />
above statement.<br />
Companies invested few resources in the introduction <strong>of</strong> the ruling. It was<br />
found that 62 percent <strong>of</strong> the sample invested less than 15,000 Euro. Among the<br />
companies that engaged the <strong>service</strong>s <strong>of</strong> a consultant, the corresponding fees<br />
amounted to 48 percent <strong>of</strong> the total cost <strong>of</strong> introduction. In most cases (77<br />
percent), the consultant’s fees are stipulated right from the beginning. It can be<br />
assumed that the consultancies are so familiar with their <strong>service</strong> that they can<br />
make an initial estimate <strong>of</strong> the cost <strong>of</strong> introducing the ruling with a high <strong>de</strong>gree<br />
<strong>of</strong> precision. This type <strong>of</strong> <strong>service</strong> has been steadily growing ever since it was<br />
Mean perceived<br />
quality<br />
Mean<br />
expectations<br />
Non-weighted<br />
quality gap<br />
Arithmetic mean<br />
benefits 13 items<br />
Chi-square 14.65 1.913 14.11 1.890<br />
Freedom <strong>de</strong>gree 3 3 3 3<br />
Asymptotic sig. 0.002 0.591 0.003 0.596<br />
Notes: a Kruskal-Wallis test; b Grouping variable: number <strong>of</strong> <strong>consultants</strong><br />
Table VI.<br />
Kruskal-Wallis test<br />
statistics for the<br />
variables ``perceived<br />
quality’’, ``expectations’’,<br />
``gap between<br />
expectations and<br />
perceived quality’’ and<br />
``mean benefits’’ when<br />
grouped by ``number <strong>of</strong><br />
<strong>consultants</strong>’’