(par) and global solar radiation transmittance t
(par) and global solar radiation transmittance t
(par) and global solar radiation transmittance t

You also want an ePaper? Increase the reach of your titles
YUMPU automatically turns print PDFs into web optimized ePapers that Google loves.
128 CHIL. J. AGR. RES. - VOL. 71 - Nº 1 - 2011<br />
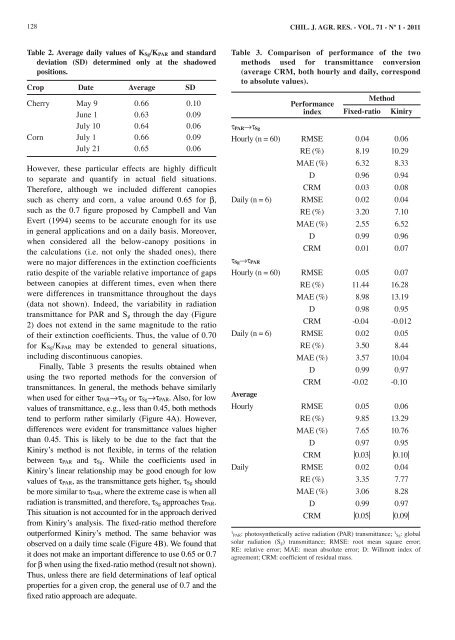
Table 2. Average daily values of K Sg/K PAR <strong>and</strong> st<strong>and</strong>ard<br />
deviation (SD) determined only at the shadowed<br />
positions.<br />
Crop Date Average SD<br />
Cherry May 9 0.66 0.10<br />
June 1 0.63 0.09<br />
July 10 0.64 0.06<br />
Corn July 1 0.66 0.09<br />
July 21 0.65 0.06<br />
However, these <strong>par</strong>ticular effects are highly difficult<br />
to se<strong>par</strong>ate <strong>and</strong> quantify in actual field situations.<br />
Therefore, although we included different canopies<br />
such as cherry <strong>and</strong> corn, a value around 0.65 for β,<br />
such as the 0.7 figure proposed by Campbell <strong>and</strong> Van<br />
Evert (1994) seems to be accurate enough for its use<br />
in general applications <strong>and</strong> on a daily basis. Moreover,<br />
when considered all the below-canopy positions in<br />
the calculations (i.e. not only the shaded ones), there<br />
were no major differences in the extinction coefficients<br />
ratio despite of the variable relative importance of gaps<br />
between canopies at different times, even when there<br />
were differences in <strong>transmittance</strong> throughout the days<br />
(data not shown). Indeed, the variability in <strong>radiation</strong><br />
<strong>transmittance</strong> for PAR <strong>and</strong> S g through the day (Figure<br />
2) does not extend in the same magnitude to the ratio<br />
of their extinction coefficients. Thus, the value of 0.70<br />
for K Sg/K PAR may be extended to general situations,<br />
including discontinuous canopies.<br />
Finally, Table 3 presents the results obtained when<br />
using the two reported methods for the conversion of<br />
<strong>transmittance</strong>s. In general, the methods behave similarly<br />
when used for either τ PAR→τ Sg or τ Sg→τ PAR. Also, for low<br />
values of <strong>transmittance</strong>, e.g., less than 0.45, both methods<br />
tend to perform rather similarly (Figure 4A). However,<br />
differences were evident for <strong>transmittance</strong> values higher<br />
than 0.45. This is likely to be due to the fact that the<br />
Kiniry’s method is not flexible, in terms of the relation<br />
between τ PAR <strong>and</strong> τ Sg. While the coefficients used in<br />
Kiniry’s linear relationship may be good enough for low<br />
values of τ PAR, as the <strong>transmittance</strong> gets higher, τ Sg should<br />
be more similar to τ PAR, where the extreme case is when all<br />
<strong>radiation</strong> is transmitted, <strong>and</strong> therefore, τ Sg approaches τ PAR.<br />
This situation is not accounted for in the approach derived<br />
from Kiniry’s analysis. The fixed-ratio method therefore<br />
outperformed Kiniry’s method. The same behavior was<br />
observed on a daily time scale (Figure 4B). We found that<br />
it does not make an important difference to use 0.65 or 0.7<br />
for β when using the fixed-ratio method (result not shown).<br />
Thus, unless there are field determinations of leaf optical<br />
properties for a given crop, the general use of 0.7 <strong>and</strong> the<br />
fixed ratio approach are adequate.<br />
Table 3. Com<strong>par</strong>ison of performance of the two<br />
methods used for <strong>transmittance</strong> conversion<br />
(average CRM, both hourly <strong>and</strong> daily, correspond<br />
to absolute values).<br />
τ PAR→τ Sg<br />
Method<br />
Performance<br />
index Fixed-ratio Kiniry<br />
Hourly (n = 60) RMSE 0.04 0.06<br />
RE (%) 8.19 10.29<br />
MAE (%) 6.32 8.33<br />
D 0.96 0.94<br />
CRM 0.03 0.08<br />
Daily (n = 6) RMSE 0.02 0.04<br />
RE (%) 3.20 7.10<br />
MAE (%) 2.55 6.52<br />
D 0.99 0.96<br />
CRM 0.01 0.07<br />
τ Sg→τ PAR<br />
Hourly (n = 60) RMSE 0.05 0.07<br />
RE (%) 11.44 16.28<br />
MAE (%) 8.98 13.19<br />
D 0.98 0.95<br />
CRM -0.04 -0.012<br />
Daily (n = 6) RMSE 0.02 0.05<br />
RE (%) 3.50 8.44<br />
MAE (%) 3.57 10.04<br />
D 0.99 0.97<br />
CRM -0.02 -0.10<br />
Average<br />
Hourly RMSE 0.05 0.06<br />
RE (%) 9.85 13.29<br />
MAE (%) 7.65 10.76<br />
D 0.97 0.95<br />
CRM |0.03| |0.10|<br />
Daily RMSE 0.02 0.04<br />
RE (%) 3.35 7.77<br />
MAE (%) 3.06 8.28<br />
D 0.99 0.97<br />
CRM |0.05| |0.09|<br />
τ PAR: photosynthetically active <strong>radiation</strong> (PAR) <strong>transmittance</strong>; τ Sg: <strong>global</strong><br />
<strong>solar</strong> <strong>radiation</strong> (S g) <strong>transmittance</strong>; RMSE: root mean square error;<br />
RE: relative error; MAE: mean absolute error; D: Willmott index of<br />
agreement; CRM: coefficient of residual mass.