Non Governmental Organisations and African Wildlife Conservation ...
Non Governmental Organisations and African Wildlife Conservation ...
Non Governmental Organisations and African Wildlife Conservation ...

Create successful ePaper yourself
Turn your PDF publications into a flip-book with our unique Google optimized e-Paper software.
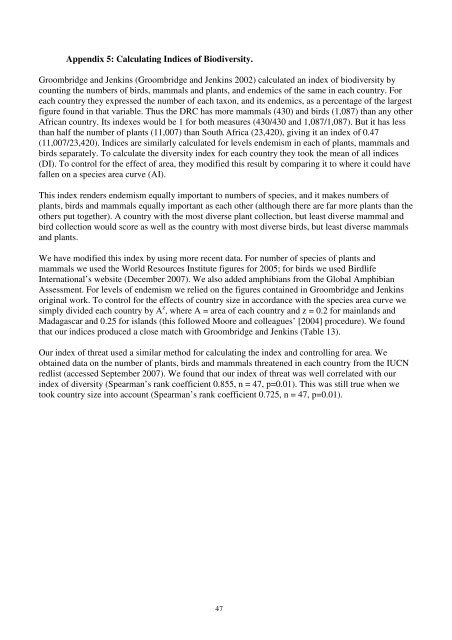
Appendix 5: Calculating Indices of Biodiversity.<br />
Groombridge <strong>and</strong> Jenkins (Groombridge <strong>and</strong> Jenkins 2002) calculated an index of biodiversity by<br />
counting the numbers of birds, mammals <strong>and</strong> plants, <strong>and</strong> endemics of the same in each country. For<br />
each country they expressed the number of each taxon, <strong>and</strong> its endemics, as a percentage of the largest<br />
figure found in that variable. Thus the DRC has more mammals (430) <strong>and</strong> birds (1,087) than any other<br />
<strong>African</strong> country. Its indexes would be 1 for both measures (430/430 <strong>and</strong> 1,087/1,087). But it has less<br />
than half the number of plants (11,007) than South Africa (23,420), giving it an index of 0.47<br />
(11,007/23,420). Indices are similarly calculated for levels endemism in each of plants, mammals <strong>and</strong><br />
birds separately. To calculate the diversity index for each country they took the mean of all indices<br />
(DI). To control for the effect of area, they modified this result by comparing it to where it could have<br />
fallen on a species area curve (AI).<br />
This index renders endemism equally important to numbers of species, <strong>and</strong> it makes numbers of<br />
plants, birds <strong>and</strong> mammals equally important as each other (although there are far more plants than the<br />
others put together). A country with the most diverse plant collection, but least diverse mammal <strong>and</strong><br />
bird collection would score as well as the country with most diverse birds, but least diverse mammals<br />
<strong>and</strong> plants.<br />
We have modified this index by using more recent data. For number of species of plants <strong>and</strong><br />
mammals we used the World Resources Institute figures for 2005; for birds we used Birdlife<br />
International’s website (December 2007). We also added amphibians from the Global Amphibian<br />
Assessment. For levels of endemism we relied on the figures contained in Groombridge <strong>and</strong> Jenkins<br />
original work. To control for the effects of country size in accordance with the species area curve we<br />
simply divided each country by A z , where A = area of each country <strong>and</strong> z = 0.2 for mainl<strong>and</strong>s <strong>and</strong><br />
Madagascar <strong>and</strong> 0.25 for isl<strong>and</strong>s (this followed Moore <strong>and</strong> colleagues’ [2004] procedure). We found<br />
that our indices produced a close match with Groombridge <strong>and</strong> Jenkins (Table 13).<br />
Our index of threat used a similar method for calculating the index <strong>and</strong> controlling for area. We<br />
obtained data on the number of plants, birds <strong>and</strong> mammals threatened in each country from the IUCN<br />
redlist (accessed September 2007). We found that our index of threat was well correlated with our<br />
index of diversity (Spearman’s rank coefficient 0.855, n = 47, p=0.01). This was still true when we<br />
took country size into account (Spearman’s rank coefficient 0.725, n = 47, p=0.01).<br />
47