Texas Teens Cover - Senate
Texas Teens Cover - Senate
Texas Teens Cover - Senate

Create successful ePaper yourself
Turn your PDF publications into a flip-book with our unique Google optimized e-Paper software.
______________________________________________________________________________________<br />
CHAPTER 5 JANUARY 2001<br />
<strong>Texas</strong> does not currently calculate a status dropout rate, which looks at<br />
individuals within a certain age range to determine the number of dropouts. For<br />
example, persons between the<br />
ages of 16 and 24 would be<br />
surveyed to determine the<br />
number of persons who are not<br />
enrolled in school and do not<br />
have a diploma, within that<br />
population. But, status rates are<br />
often ambiguous because they are<br />
based on population estimates. A<br />
completion rate shows the<br />
number of students under a<br />
certain age who have completed<br />
high school. This rate could be<br />
manipulated by including<br />
students who do not graduate<br />
from high school but, for<br />
example, receive GEDs or<br />
complete all of the requirements<br />
for graduation but do not pass the<br />
TAAS.<br />
In 1987, the 70th Legislature<br />
required the TEA to prepare<br />
biennial reports on the number of<br />
public school dropouts and to<br />
provide each legislature with a<br />
plan for reducing the dropout<br />
rate. The legislature set a goal of<br />
a longitudinal state dropout rate<br />
of not more than five percent by<br />
the 1997-1998 school year for<br />
students enrolled in 7th thru 12th<br />
grade. The legislature also set a<br />
cross-sectional state longitudinal<br />
dropout rate of not more than five<br />
percent, meaning the longitudinal<br />
dropout rates for each ethnic<br />
group should be less than five<br />
percent. In 1997-1998, TEA<br />
reported an actual longitudinal<br />
dropout rate of 14.7 percent, 9<br />
percent for white students, 18.9 percent for African-American students, 20.4<br />
percent for Hispanic students, and 7.6 percent for other students. 5<br />
<strong>Texas</strong> Data Gathering on Dropouts<br />
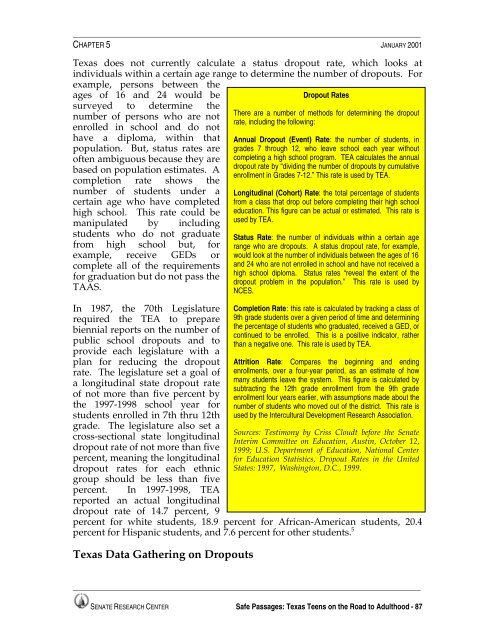
Dropout Rates<br />
There are a number of methods for determining the dropout<br />
rate, including the following:<br />
Annual Dropout (Event) Rate: the number of students, in<br />
grades 7 through 12, who leave school each year without<br />
completing a high school program. TEA calculates the annual<br />
dropout rate by “dividing the number of dropouts by cumulative<br />
enrollment in Grades 7-12.” This rate is used by TEA.<br />
Longitudinal (Cohort) Rate: the total percentage of students<br />
from a class that drop out before completing their high school<br />
education. This figure can be actual or estimated. This rate is<br />
used by TEA.<br />
Status Rate: the number of individuals within a certain age<br />
range who are dropouts. A status dropout rate, for example,<br />
would look at the number of individuals between the ages of 16<br />
and 24 who are not enrolled in school and have not received a<br />
high school diploma. Status rates “reveal the extent of the<br />
dropout problem in the population.” This rate is used by<br />
NCES.<br />
Completion Rate: this rate is calculated by tracking a class of<br />
9th grade students over a given period of time and determining<br />
the percentage of students who graduated, received a GED, or<br />
continued to be enrolled. This is a positive indicator, rather<br />
than a negative one. This rate is used by TEA.<br />
Attrition Rate: Compares the beginning and ending<br />
enrollments, over a four-year period, as an estimate of how<br />
many students leave the system. This figure is calculated by<br />
subtracting the 12th grade enrollment from the 9th grade<br />
enrollment four years earlier, with assumptions made about the<br />
number of students who moved out of the district. This rate is<br />
used by the Intercultural Development Research Association.<br />
Sources: Testimony by Criss Cloudt before the <strong>Senate</strong><br />
Interim Committee on Education, Austin, October 12,<br />
1999; U.S. Department of Education, National Center<br />
for Education Statistics, Dropout Rates in the United<br />
States: 1997, Washington, D.C., 1999.<br />
______________________________________________________________________________________<br />
SENATE RESEARCH CENTER Safe Passages: <strong>Texas</strong> <strong>Teens</strong> on the Road to Adulthood - 87