Evaluation of Cotton Fibers Stickiness by Colorimetric Method
Evaluation of Cotton Fibers Stickiness by Colorimetric Method
Evaluation of Cotton Fibers Stickiness by Colorimetric Method

Create successful ePaper yourself
Turn your PDF publications into a flip-book with our unique Google optimized e-Paper software.
Shams-Nateri and Mohajerani<br />
The end point <strong>of</strong> titration is evaluated <strong>by</strong> color<br />
change from red to faint blue upon oxidation which is<br />
shown <strong>by</strong> tris(1,10-phenanthroline)-iron(II) sulfate. The<br />
titration can be calibrated against known quantities <strong>of</strong><br />
glucose [10-12]. The results <strong>of</strong> this method are shown in<br />
Table 1 as Sugar content.<br />
2.4.<strong>Colorimetric</strong> method<br />
In this method, each cotton fiber sample was divided in<br />
two parts. First part (i.e. sample A) was washed with<br />
boiling water. During this process, the honeydew was<br />
extracted from cotton fibers. The washed cotton was<br />
dried in oven at 150 o C for 20 minutes. The second part<br />
(i.e. sample B) was used without washing, instead it was<br />
only heated at 150 o C for 20 minutes. During this process,<br />
honeydew was allowed to caramelize and its color<br />
changed to yellow and brown. In addition, any<br />
contaminating honeydew converted into a non-sticky or<br />
non-adhesive and brittle form. Heating did not cause any<br />
discoloration or color change <strong>of</strong> cotton fibers. The yellow<br />
index (+b) <strong>of</strong> samples A and B were measured <strong>by</strong><br />
colorimeter. Finally, cotton stickiness index was<br />
calculated from Equation 1. The results <strong>of</strong> this method<br />
are shown in Table 1 as “stickiness Index”.<br />
Stickness=Yellow index <strong>of</strong> sample B -Yellow index <strong>of</strong><br />
sample A (1)<br />
3. Results and discussion<br />
In this work, the cotton fibers stickiness was measured<br />
<strong>by</strong> a novel mthod based on color paramter <strong>of</strong> raw and<br />
heated cotton fiber. The peformance <strong>of</strong> new method was<br />
evaluated <strong>by</strong> comparison with sugar content test and the<br />
thermodetector methods. The results <strong>of</strong> stickiness<br />
estimation <strong>by</strong> the colorimetric method, sugar content test<br />
and the thermodetector methods are presented in Table 1.<br />
For comparing the stickiness index in colorimetric<br />
method with the results <strong>of</strong> other methods, cotton fibers<br />
was graded in three categories <strong>of</strong> bad, medium and good<br />
quality <strong>by</strong> using Minitab statistical s<strong>of</strong>tware. The<br />
similarity level <strong>of</strong> clustering was 93.71%. Table 2 shows<br />
the statistical results <strong>of</strong> three categories as mean,<br />
maximum (max), minimum (min) and standard deviation<br />
(STD) values.<br />
A high-quality cotton fiber has little sugar content,<br />
small yellow index or stickiness index and few sticky<br />
points number. Similar results are obtained from Figures<br />
1 and 2. In these figures, there are good correlation<br />
between stickiness index and sugar content and sticky<br />
points number <strong>of</strong> thermodetector method. The coefficient<br />
<strong>of</strong> correlation between stickiness index and sugar content<br />
is 0.93 and the coefficient <strong>of</strong> correlation between<br />
stickiness index and sticky points number is 0.9. The<br />
obtained results show that the results <strong>of</strong> colorimetric<br />
method is more closely correlated to sugar content test<br />
than the thermodetector method.<br />
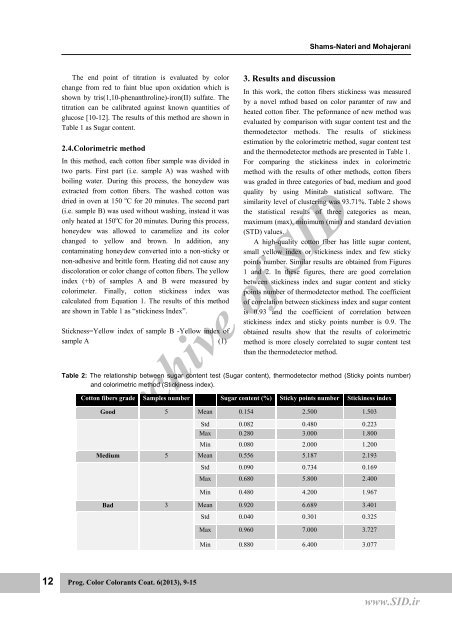
Table 2: The relationship between sugar content test (Sugar content), thermodetector method (Sticky points number)<br />
and colorimetric method (<strong>Stickiness</strong> index).<br />
<strong>Cotton</strong> fibers grade Samples number Sugar content (%) Sticky points number <strong>Stickiness</strong> index<br />
Good 5 Mean 0.154 2.500 1.503<br />
Archive <strong>of</strong> SID<br />
Std 0.082 0.480 0.223<br />
Max 0.280 3.000 1.800<br />
Min 0.080 2.000 1.200<br />
Medium 5 Mean 0.556 5.187 2.193<br />
Std 0.090 0.734 0.169<br />
Max 0.680 5.800 2.400<br />
Min 0.480 4.200 1.967<br />
Bad 3 Mean 0.920 6.689 3.401<br />
Std 0.040 0.301 0.325<br />
Max 0.960 7.000 3.727<br />
Min 0.880 6.400 3.077<br />
12 Prog. Color Colorants Coat. 6(2013), 9-15<br />
www.SID.ir