Population dynamics and spatial pattern of small mammals in ...
Population dynamics and spatial pattern of small mammals in ...
Population dynamics and spatial pattern of small mammals in ...

You also want an ePaper? Increase the reach of your titles
YUMPU automatically turns print PDFs into web optimized ePapers that Google loves.
HORVÁTH ET AL.: POPULATIONDYNAMICS AND SPATIAL PATTERN<br />
197<br />
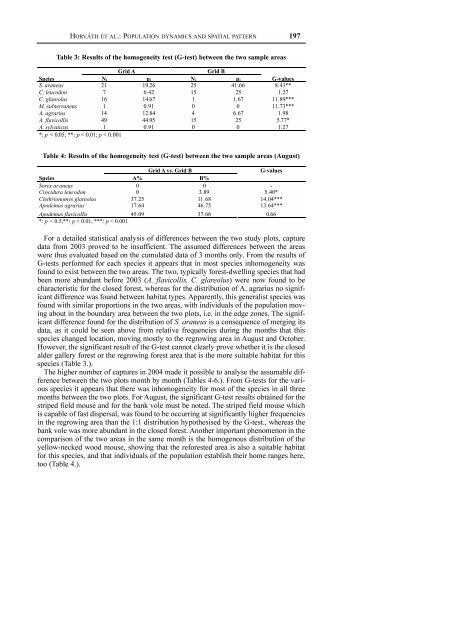
Table 3: Results <strong>of</strong> the homogeneity test (G-test) between the two sample areas<br />
Table 4: Results <strong>of</strong> the homogeneity test (G-test) between the two sample areas (August)<br />
For a detailed statistical analysis <strong>of</strong> differences between the two study plots, capture<br />
data from 2003 proved to be <strong>in</strong>sufficient. The assumed differences between the areas<br />
were thus evaluated based on the cumulated data <strong>of</strong> 3 months only. From the results <strong>of</strong><br />
G-tests performed for each species it appears that <strong>in</strong> most species <strong>in</strong>homogeneity was<br />
found to exist between the two areas. The two, typically forest-dwell<strong>in</strong>g species that had<br />
been more abundant before 2003 (A. flavicollis, C. glareolus) were now found to be<br />
characteristic for the closed forest, whereas for the distribution <strong>of</strong> A. agrarius no significant<br />
difference was found between habitat types. Apparently, this generalist species was<br />
found with similar proportions <strong>in</strong> the two areas, with <strong>in</strong>dividuals <strong>of</strong> the population mov<strong>in</strong>g<br />
about <strong>in</strong> the boundary area between the two plots, i.e. <strong>in</strong> the edge zones. The significant<br />
difference found for the distribution <strong>of</strong> S. araneus is a consequence <strong>of</strong> merg<strong>in</strong>g its<br />
data, as it could be seen above from relative frequencies dur<strong>in</strong>g the months that this<br />
species changed location, mov<strong>in</strong>g mostly to the regrow<strong>in</strong>g area <strong>in</strong> August <strong>and</strong> October.<br />
However, the significant result <strong>of</strong> the G-test cannot clearly prove whether it is the closed<br />
alder gallery forest or the regrow<strong>in</strong>g forest area that is the more suitable habitat for this<br />
species (Table 3.).<br />
The higher number <strong>of</strong> captures <strong>in</strong> 2004 made it possible to analyse the assumable difference<br />
between the two plots month by month (Tables 4-6.). From G-tests for the various<br />
species it appears that there was <strong>in</strong>homogeneity for most <strong>of</strong> the species <strong>in</strong> all three<br />
months between the two plots. For August, the significant G-test results obta<strong>in</strong>ed for the<br />
striped field mouse <strong>and</strong> for the bank vole must be noted. The striped field mouse which<br />
is capable <strong>of</strong> fast dispersal, was found to be occurr<strong>in</strong>g at significantly higher frequencies<br />
<strong>in</strong> the regrow<strong>in</strong>g area than the 1:1 distribution hypothesised by the G-test., whereas the<br />
bank vole was more abundant <strong>in</strong> the closed forest. Another important phenomenon <strong>in</strong> the<br />
comparison <strong>of</strong> the two areas <strong>in</strong> the same month is the homogenous distribution <strong>of</strong> the<br />
yellow-necked wood mouse, show<strong>in</strong>g that the reforested area is also a suitable habitat<br />
for this species, <strong>and</strong> that <strong>in</strong>dividuals <strong>of</strong> the population establish their home ranges here,<br />
too (Table 4.).