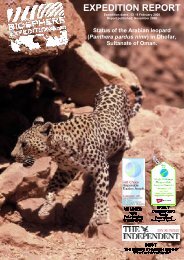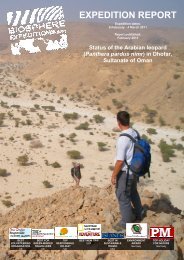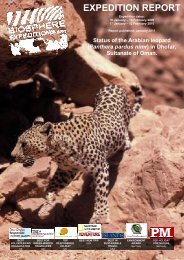
EXPEDITION REPORT 2007 - Biosphere Expeditions
EXPEDITION REPORT 2007 - Biosphere Expeditions
EXPEDITION REPORT 2007 - Biosphere Expeditions

Create successful ePaper yourself
Turn your PDF publications into a flip-book with our unique Google optimized e-Paper software.
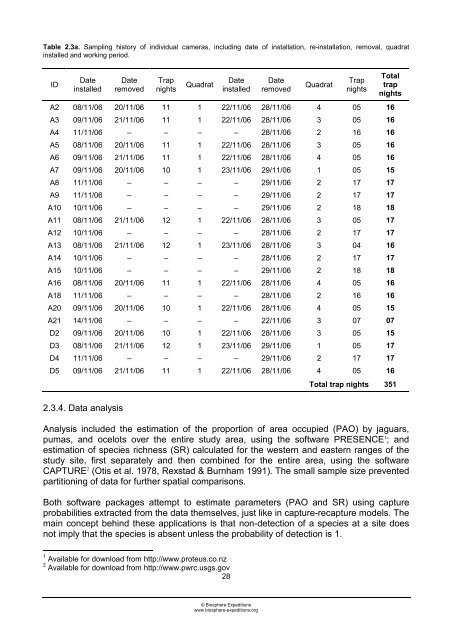
Table 2.3a. Sampling history of individual cameras, including date of installation, re-installation, removal, quadrat<br />
installed and working period.<br />
ID<br />
Date<br />
installed<br />
Date<br />
removed<br />
Trap<br />
nights Quadrat<br />
1<br />
Available for download from http://www.proteus.co.nz<br />
2<br />
Available for download from http://www.pwrc.usgs.gov<br />
28<br />
Date<br />
installed<br />
© <strong>Biosphere</strong> <strong>Expeditions</strong><br />
www.biosphere-expeditions.org<br />
Date<br />
removed<br />
Quadrat<br />
Trap<br />
nights<br />
A2 08/11/06 20/11/06 11 1 22/11/06 28/11/06 4 05 16<br />
A3 09/11/06 21/11/06 11 1 22/11/06 28/11/06 3 05 16<br />
A4 11/11/06 – – – – 28/11/06 2 16 16<br />
A5 08/11/06 20/11/06 11 1 22/11/06 28/11/06 3 05 16<br />
A6 09/11/06 21/11/06 11 1 22/11/06 28/11/06 4 05 16<br />
A7 09/11/06 20/11/06 10 1 23/11/06 29/11/06 1 05 15<br />
A8 11/11/06 – – – – 29/11/06 2 17 17<br />
A9 11/11/06 – – – – 29/11/06 2 17 17<br />
A10 10/11/06 – – – – 29/11/06 2 18 18<br />
A11 08/11/06 21/11/06 12 1 22/11/06 28/11/06 3 05 17<br />
A12 10/11/06 – – – – 28/11/06 2 17 17<br />
A13 08/11/06 21/11/06 12 1 23/11/06 28/11/06 3 04 16<br />
A14 10/11/06 – – – – 28/11/06 2 17 17<br />
A15 10/11/06 – – – – 29/11/06 2 18 18<br />
A16 08/11/06 20/11/06 11 1 22/11/06 28/11/06 4 05 16<br />
A18 11/11/06 – – – – 28/11/06 2 16 16<br />
A20 09/11/06 20/11/06 10 1 22/11/06 28/11/06 4 05 15<br />
A21 14/11/06 – – – – 22/11/06 3 07 07<br />
D2 09/11/06 20/11/06 10 1 22/11/06 28/11/06 3 05 15<br />
D3 08/11/06 21/11/06 12 1 23/11/06 29/11/06 1 05 17<br />
D4 11/11/06 – – – – 29/11/06 2 17 17<br />
D5 09/11/06 21/11/06 11 1 22/11/06 28/11/06 4 05 16<br />
2.3.4. Data analysis<br />
Total<br />
trap<br />
nights<br />
Total trap nights 351<br />
Analysis included the estimation of the proportion of area occupied (PAO) by jaguars,<br />
pumas, and ocelots over the entire study area, using the software PRESENCE 1 ; and<br />
estimation of species richness (SR) calculated for the western and eastern ranges of the<br />
study site, first separately and then combined for the entire area, using the software<br />
CAPTURE 2 (Otis et al. 1978, Rexstad & Burnham 1991). The small sample size prevented<br />
partitioning of data for further spatial comparisons.<br />
Both software packages attempt to estimate parameters (PAO and SR) using capture<br />
probabilities extracted from the data themselves, just like in capture-recapture models. The<br />
main concept behind these applications is that non-detection of a species at a site does<br />
not imply that the species is absent unless the probability of detection is 1.