Lifeskills Mathematics Test - Scottish Qualifications Authority
Lifeskills Mathematics Test - Scottish Qualifications Authority
Lifeskills Mathematics Test - Scottish Qualifications Authority

Create successful ePaper yourself
Turn your PDF publications into a flip-book with our unique Google optimized e-Paper software.
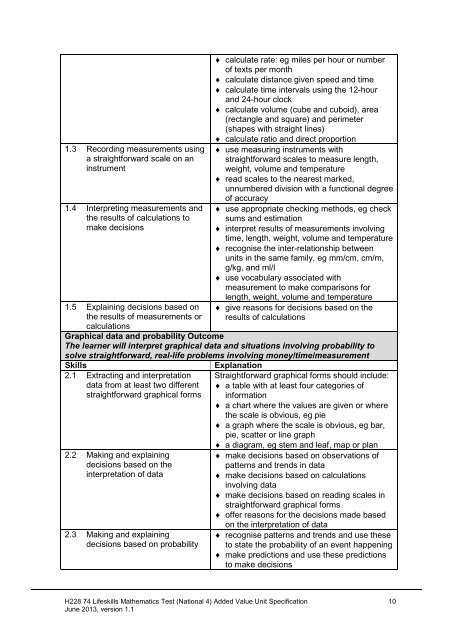
1.3 Recording measurements using<br />
a straightforward scale on an<br />
instrument<br />
1.4 Interpreting measurements and<br />
the results of calculations to<br />
make decisions<br />
1.5 Explaining decisions based on<br />
the results of measurements or<br />
calculations<br />
♦ calculate rate: eg miles per hour or number<br />
of texts per month<br />
♦ calculate distance given speed and time<br />
♦ calculate time intervals using the 12-hour<br />
and 24-hour clock<br />
♦ calculate volume (cube and cuboid), area<br />
(rectangle and square) and perimeter<br />
(shapes with straight lines)<br />
♦ calculate ratio and direct proportion<br />
♦ use measuring instruments with<br />
straightforward scales to measure length,<br />
weight, volume and temperature<br />
♦ read scales to the nearest marked,<br />
unnumbered division with a functional degree<br />
of accuracy<br />
♦ use appropriate checking methods, eg check<br />
sums and estimation<br />
♦ interpret results of measurements involving<br />
time, length, weight, volume and temperature<br />
♦ recognise the inter-relationship between<br />
units in the same family, eg mm/cm, cm/m,<br />
g/kg, and ml/l<br />
♦ use vocabulary associated with<br />
measurement to make comparisons for<br />
length, weight, volume and temperature<br />
♦ give reasons for decisions based on the<br />
results of calculations<br />
Graphical data and probability Outcome<br />
The learner wilI interpret graphical data and situations involving probability to<br />
solve straightforward, real-life problems involving money/time/measurement<br />
Skills<br />
2.1 Extracting and interpretation<br />
data from at least two different<br />
straightforward graphical forms<br />
2.2 Making and explaining<br />
decisions based on the<br />
interpretation of data<br />
2.3 Making and explaining<br />
decisions based on probability<br />
Explanation<br />
Straightforward graphical forms should include:<br />
♦ a table with at least four categories of<br />
information<br />
♦ a chart where the values are given or where<br />
the scale is obvious, eg pie<br />
♦ a graph where the scale is obvious, eg bar,<br />
pie, scatter or line graph<br />
♦ a diagram, eg stem and leaf, map or plan<br />
♦ make decisions based on observations of<br />
patterns and trends in data<br />
♦ make decisions based on calculations<br />
involving data<br />
♦ make decisions based on reading scales in<br />
straightforward graphical forms<br />
♦ offer reasons for the decisions made based<br />
on the interpretation of data<br />
♦ recognise patterns and trends and use these<br />
to state the probability of an event happening<br />
♦ make predictions and use these predictions<br />
to make decisions<br />
H228 74 <strong>Lifeskills</strong> <strong>Mathematics</strong> <strong>Test</strong> (National 4) Added Value Unit Specification 10<br />
June 2013, version 1.1