Download - APRA
Download - APRA
Download - APRA

Create successful ePaper yourself
Turn your PDF publications into a flip-book with our unique Google optimized e-Paper software.
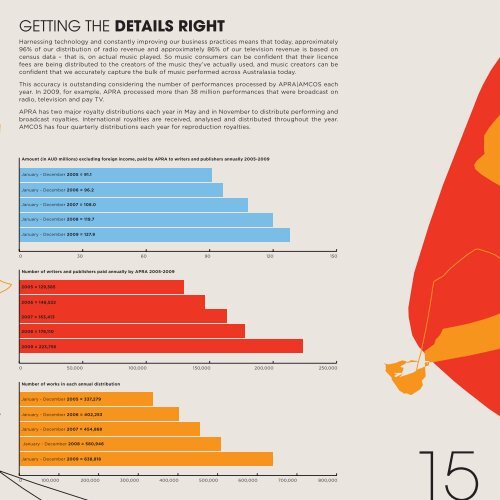
getting the Details Right<br />
Harnessing technology and constantly improving our business practices means that today, approximately<br />
96% of our distribution of radio revenue and approximately 86% of our television revenue is based on<br />
census data – that is, on actual music played. So music consumers can be confident that their licence<br />
fees are being distributed to the creators of the music they’ve actually used, and music creators can be<br />
confident that we accurately capture the bulk of music performed across Australasia today.<br />
This accuracy is outstanding considering the number of performances processed by <strong>APRA</strong>|AMCOS each<br />
year. In 2009, for example, <strong>APRA</strong> processed more than 38 million performances that were broadcast on<br />
radio, television and pay TV.<br />
<strong>APRA</strong> has two major royalty distributions each year in May and in November to distribute performing and<br />
broadcast royalties. International royalties are received, analysed and distributed throughout the year.<br />
AMCOS has four quarterly distributions each year for reproduction royalties.<br />
Amount (in AUD millions) excluding foreign income, paid by <strong>APRA</strong> to writers and publishers annually 2005-2009<br />
January - December 2005 = 91.1<br />
January - December 2006 = 96.2<br />
January - December 2007 = 108.0<br />
January - December 2008 = 119.7<br />
January - December 2009 = 127.9<br />
0 30 60 90 120 150<br />
Number of writers and publishers paid annually by <strong>APRA</strong> 2005-2009<br />
2005 = 129,585<br />
2006 = 146,522<br />
2007 = 163,413<br />
2008 = 178,110<br />
2009 = 223,756<br />
0 50,000 100,000 150,000 200,000 250,000<br />
Number of works in each annual distribution<br />
January - December 2005 = 337,279<br />
January - December 2006 = 402,253<br />
January - December 2007 = 454,868<br />
January - December 2008 = 580,946<br />
January - December 2009 = 638,818<br />
0 100,000 200,000 300,000 400,000 500,000 600,000 700,000 800,000<br />
15