FINANCIAL RESULTS Q1 2011 - Statkraft
FINANCIAL RESULTS Q1 2011 - Statkraft
FINANCIAL RESULTS Q1 2011 - Statkraft

You also want an ePaper? Increase the reach of your titles
YUMPU automatically turns print PDFs into web optimized ePapers that Google loves.
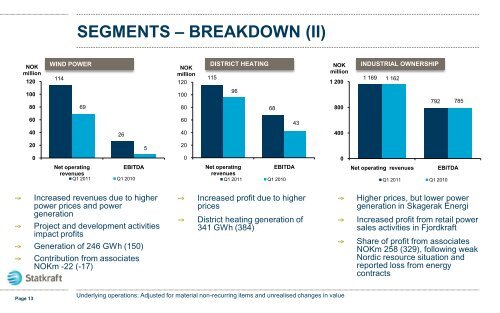
SEGMENTS – BREAKDOWN (II)<br />
NOK<br />
million<br />
120<br />
100<br />
80<br />
WIND POWER<br />
114<br />
69<br />
NOK<br />
million<br />
120<br />
100<br />
80<br />
DISTRICT HEATING<br />
115<br />
96<br />
68<br />
NOK<br />
million<br />
1 200<br />
800<br />
INDUSTRIAL OWNERSHIP<br />
1 169 1 162<br />
792<br />
785<br />
60<br />
60<br />
43<br />
40<br />
26<br />
40<br />
400<br />
20<br />
5<br />
20<br />
0<br />
Net operating<br />
EBITDA<br />
revenues<br />
<strong>Q1</strong> <strong>2011</strong> <strong>Q1</strong> 2010<br />
0<br />
Net operating<br />
EBITDA<br />
revenues<br />
<strong>Q1</strong> <strong>2011</strong> <strong>Q1</strong> 2010<br />
0<br />
Net operating revenues<br />
<strong>Q1</strong> <strong>2011</strong> <strong>Q1</strong> 2010<br />
EBITDA<br />
Increased revenues due to higher<br />
power prices and power<br />
generation<br />
Project and development activities<br />
impact profits<br />
Generation of 246 GWh (150)<br />
Contribution from associates<br />
NOKm -22 (-17)<br />
Increased profit due to higher<br />
prices<br />
District heating generation of<br />
341 GWh (384)<br />
Higher prices, but lower power<br />
generation in Skagerak Energi<br />
Increased profit from retail power<br />
sales activities in Fjordkraft<br />
Share of profit from associates<br />
NOKm 258 (329), following weak<br />
Nordic resource situation and<br />
reported loss from energy<br />
contracts<br />
Page 13<br />
Underlying operations: Adjusted for material non-recurring items and unrealised changes in value