The Addenbrooke's Cognitive Examination Revised (ACE-R): a brief ...
The Addenbrooke's Cognitive Examination Revised (ACE-R): a brief ...
The Addenbrooke's Cognitive Examination Revised (ACE-R): a brief ...

You also want an ePaper? Increase the reach of your titles
YUMPU automatically turns print PDFs into web optimized ePapers that Google loves.
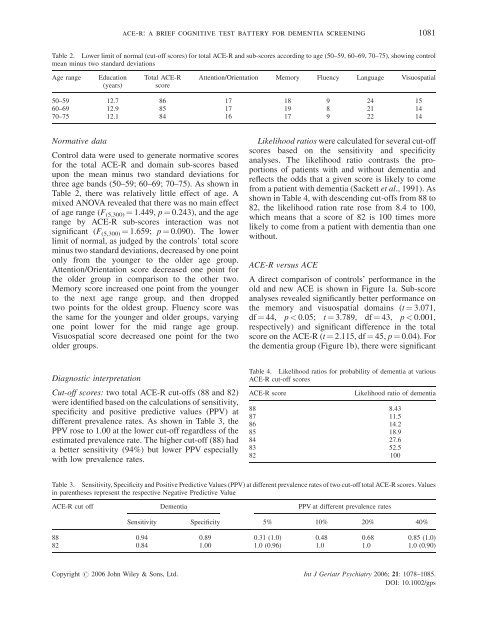
ace-r: a <strong>brief</strong> cognitive test battery for dementia screening 1081<br />
Table 2. Lower limit of normal (cut-off scores) for total <strong>ACE</strong>-R and sub-scores according to age (50–59, 60–69, 70–75), showing control<br />
mean minus two standard deviations<br />
Age range<br />
Education<br />
(years)<br />
Total <strong>ACE</strong>-R<br />
score<br />
Attention/Orientation Memory Fluency Language Visuospatial<br />
50–59 12.7 86 17 18 9 24 15<br />
60–69 12.9 85 17 19 8 21 14<br />
70–75 12.1 84 16 17 9 22 14<br />
Normative data<br />
Control data were used to generate normative scores<br />
for the total <strong>ACE</strong>-R and domain sub-scores based<br />
upon the mean minus two standard deviations for<br />
three age bands (50–59; 60–69; 70–75). As shown in<br />
Table 2, there was relatively little effect of age. A<br />
mixed ANOVA revealed that there was no main effect<br />
of age range (F (5,300) ¼ 1.449, p ¼ 0.243), and the age<br />
range by <strong>ACE</strong>-R sub-scores interaction was not<br />
significant (F (5,300) ¼ 1.659; p ¼ 0.090). <strong>The</strong> lower<br />
limit of normal, as judged by the controls’ total score<br />
minus two standard deviations, decreased by one point<br />
only from the younger to the older age group.<br />
Attention/Orientation score decreased one point for<br />
the older group in comparison to the other two.<br />
Memory score increased one point from the younger<br />
to the next age range group, and then dropped<br />
two points for the oldest group. Fluency score was<br />
the same for the younger and older groups, varying<br />
one point lower for the mid range age group.<br />
Visuospatial score decreased one point for the two<br />
older groups.<br />
Likelihood ratios were calculated for several cut-off<br />
scores based on the sensitivity and specificity<br />
analyses. <strong>The</strong> likelihood ratio contrasts the proportions<br />
of patients with and without dementia and<br />
reflects the odds that a given score is likely to come<br />
from a patient with dementia (Sackett et al., 1991). As<br />
shown in Table 4, with descending cut-offs from 88 to<br />
82, the likelihood ration rate rose from 8.4 to 100,<br />
which means that a score of 82 is 100 times more<br />
likely to come from a patient with dementia than one<br />
without.<br />
<strong>ACE</strong>-R versus <strong>ACE</strong><br />
A direct comparison of controls’ performance in the<br />
old and new <strong>ACE</strong> is shown in Figure 1a. Sub-score<br />
analyses revealed significantly better performance on<br />
the memory and visuospatial domains (t ¼ 3.071,<br />
df ¼ 44, p < 0.05; t ¼ 3.789, df ¼ 43, p < 0.001,<br />
respectively) and significant difference in the total<br />
score on the <strong>ACE</strong>-R (t ¼ 2.115, df ¼ 45, p ¼ 0.04). For<br />
the dementia group (Figure 1b), there were significant<br />
Diagnostic interpretation<br />
Cut-off scores: two total <strong>ACE</strong>-R cut-offs (88 and 82)<br />
were identified based on the calculations of sensitivity,<br />
specificity and positive predictive values (PPV) at<br />
different prevalence rates. As shown in Table 3, the<br />
PPV rose to 1.00 at the lower cut-off regardless of the<br />
estimated prevalence rate. <strong>The</strong> higher cut-off (88) had<br />
a better sensitivity (94%) but lower PPV especially<br />
with low prevalence rates.<br />
Table 4. Likelihood ratios for probability of dementia at various<br />
<strong>ACE</strong>-R cut-off scores<br />
<strong>ACE</strong>-R score<br />
Likelihood ratio of dementia<br />
88 8.43<br />
87 11.5<br />
86 14.2<br />
85 18.9<br />
84 27.6<br />
83 52.5<br />
82 100<br />
Table 3. Sensitivity, Specificity and Positive Predictive Values (PPV) at different prevalence rates of two cut-off total <strong>ACE</strong>-R scores. Values<br />
in parentheses represent the respective Negative Predictive Value<br />
<strong>ACE</strong>-R cut off Dementia PPV at different prevalence rates<br />
Sensitivity Specificity 5% 10% 20% 40%<br />
88 0.94 0.89 0.31 (1.0) 0.48 0.68 0.85 (1.0)<br />
82 0.84 1.00 1.0 (0.96) 1.0 1.0 1.0 (0.90)<br />
Copyright # 2006 John Wiley & Sons, Ltd. Int J Geriatr Psychiatry 2006; 21: 1078–1085.<br />
DOI: 10.1002/gps