Nesting of green turtles (Chelonia mydas) at ... - Seaturtle.org
Nesting of green turtles (Chelonia mydas) at ... - Seaturtle.org
Nesting of green turtles (Chelonia mydas) at ... - Seaturtle.org
Create successful ePaper yourself
Turn your PDF publications into a flip-book with our unique Google optimized e-Paper software.
154 B.J. Godley et al. / Biological Conserv<strong>at</strong>ion 97 (2001) 151±158<br />
nesting success was 99.5 (S.D.= 122; range= 5±444)<br />
while the mean number <strong>of</strong> surveys to collect these d<strong>at</strong>a<br />
was 14.4 (S.D.= 7.5; range= 10±37). The mean values<br />
for nesting success for each beach varied 4-fold, from<br />
0.13 on beach 10 to 0.52 on beach 12 (Table 1), with a<br />
mean <strong>of</strong> 0.33 for all beaches (S.D.= 0.08; n=25 beaches).<br />
The overall nesting success for Ascension Island<br />
calcul<strong>at</strong>ed as total nests divided by total activities was<br />
0.39. When nesting success for the three main beaches<br />
(1, 12, 27) were plotted against time, no trends were<br />
detected.<br />
By multiplying the nest success (p) for each beach by<br />
the respective number <strong>of</strong> activities (a), the number <strong>of</strong><br />
nests on Ascension Island over the season was estim<strong>at</strong>ed<br />
<strong>at</strong> 13,881. The f<strong>at</strong>e <strong>of</strong> a nesting activity is e€ectively a<br />
binomial problem, with outcomes <strong>of</strong> either a ``nest'' or<br />
``no nest''. We used a standard equ<strong>at</strong>ion to calcul<strong>at</strong>e the<br />
variance in the estim<strong>at</strong>e <strong>of</strong> the mean nesting success<br />
value for each beach, i.e. variance=pq/a where q=1 p<br />
(Bailey, 1981), and then from this variance 95% con-<br />
®dence limits (95% CL) were determined. Since the<br />
variance <strong>of</strong> the sum <strong>of</strong> a series <strong>of</strong> estim<strong>at</strong>es is simply the<br />
sum <strong>of</strong> their individual variances, the 95% con®dence<br />
limits on the estim<strong>at</strong>e for the total number <strong>of</strong> nests was<br />
readily determined as 13,092±14,660.<br />
3.2. Magnitude <strong>of</strong> nesting<br />
A total <strong>of</strong> 36,036 marine turtle nesting activities was<br />
estim<strong>at</strong>ed over the entire season, with the number <strong>of</strong><br />
activities per beach ranging from 47 to 9651. Density <strong>of</strong><br />
nesting activities varied widely from 534 to 10,001<br />
activities/km, as did nest density which ranged from 213<br />
to 5200 nests/km. Overall density <strong>of</strong> activities (total<br />
activities/total beach surveyed) was 6204 activities/km<br />
and total nest density (total nests/total beach surveyed)<br />
was 2390 nests/km.<br />
3.3. Sp<strong>at</strong>ial distribution <strong>of</strong> nesting e€ort<br />
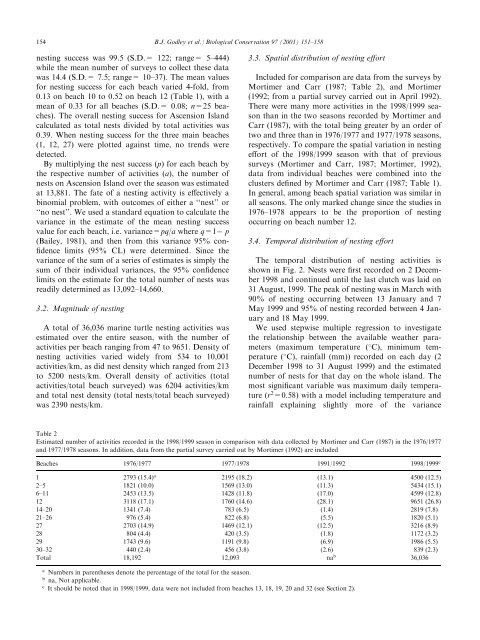
Included for comparison are d<strong>at</strong>a from the surveys by<br />
Mortimer and Carr (1987; Table 2), and Mortimer<br />
(1992; from a partial survey carried out in April 1992).<br />
There were many more activities in the 1998/1999 season<br />
than in the two seasons recorded by Mortimer and<br />
Carr (1987), with the total being gre<strong>at</strong>er by an order <strong>of</strong><br />
two and three than in 1976/1977 and 1977/1978 seasons,<br />
respectively. To compare the sp<strong>at</strong>ial vari<strong>at</strong>ion in nesting<br />
e€ort <strong>of</strong> the 1998/1999 season with th<strong>at</strong> <strong>of</strong> previous<br />
surveys (Mortimer and Carr, 1987; Mortimer, 1992),<br />
d<strong>at</strong>a from individual beaches were combined into the<br />
clusters de®ned by Mortimer and Carr (1987; Table 1).<br />
In general, among beach sp<strong>at</strong>ial vari<strong>at</strong>ion was similar in<br />
all seasons. The only marked change since the studies in<br />
1976±1978 appears to be the proportion <strong>of</strong> nesting<br />
occurring on beach number 12.<br />
3.4. Temporal distribution <strong>of</strong> nesting e€ort<br />
The temporal distribution <strong>of</strong> nesting activities is<br />
shown in Fig. 2. Nests were ®rst recorded on 2 December<br />
1998 and continued until the last clutch was laid on<br />
31 August, 1999. The peak <strong>of</strong> nesting was in March with<br />
90% <strong>of</strong> nesting occurring between 13 January and 7<br />
May 1999 and 95% <strong>of</strong> nesting recorded between 4 January<br />
and 18 May 1999.<br />
We used stepwise multiple regression to investig<strong>at</strong>e<br />
the rel<strong>at</strong>ionship between the available we<strong>at</strong>her parameters<br />
(maximum temper<strong>at</strong>ure ( C), minimum temper<strong>at</strong>ure<br />
( C), rainfall (mm)) recorded on each day (2<br />
December 1998 to 31 August 1999) and the estim<strong>at</strong>ed<br />
number <strong>of</strong> nests for th<strong>at</strong> day on the whole island. The<br />
most signi®cant variable was maximum daily temper<strong>at</strong>ure<br />
(r 2 =0.58) with a model including temper<strong>at</strong>ure and<br />
rainfall explaining slightly more <strong>of</strong> the variance<br />
Table 2<br />
Estim<strong>at</strong>ed number <strong>of</strong> activities recorded in the 1998/1999 season in comparison with d<strong>at</strong>a collected by Mortimer and Carr (1987) in the 1976/1977<br />
and 1977/1978 seasons. In addition, d<strong>at</strong>a from the partial survey carried out by Mortimer (1992) are included<br />
Beaches 1976/1977 1977/1978 1991/1992 1998/1999 c<br />
1 2793 (15.4) a 2195 (18.2) (13.1) 4500 (12.5)<br />
2±5 1821 (10.0) 1569 (13.0) (11.3) 5434 (15.1)<br />
6±11 2453 (13.5) 1428 (11.8) (17.0) 4599 (12.8)<br />
12 3118 (17.1) 1760 (14.6) (28.1) 9651 (26.8)<br />
14±20 1341 (7.4) 783 (6.5) (1.4) 2819 (7.8)<br />
21±26 976 (5.4) 822 (6.8) (5.5) 1820 (5.1)<br />
27 2703 (14.9) 1469 (12.1) (12.5) 3216 (8.9)<br />
28 804 (4.4) 420 (3.5) (1.8) 1172 (3.2)<br />
29 1743 (9.6) 1191 (9.8) (6.9) 1986 (5.5)<br />
30±32 440 (2.4) 456 (3.8) (2.6) 839 (2.3)<br />
Total 18,192 12,093 na b 36,036<br />
a Numbers in parentheses denote the percentage <strong>of</strong> the total for the season.<br />
b na, Not applicable.<br />
c It should be noted th<strong>at</strong> in 1998/1999, d<strong>at</strong>a were not included from beaches 13, 18, 19, 20 and 32 (see Section 2).


