Working Paper - Urban Institute
Working Paper - Urban Institute
Working Paper - Urban Institute

Create successful ePaper yourself
Turn your PDF publications into a flip-book with our unique Google optimized e-Paper software.
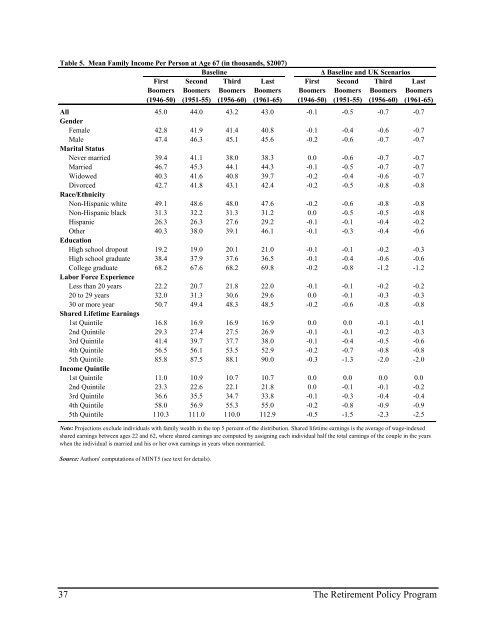
Table 5. Mean Family Income Per Person at Age 67 (in thousands, $2007)<br />
Baseline<br />
Δ Baseline and UK Scenarios<br />
First<br />
Boomers<br />
Second<br />
Boomers<br />
Third<br />
Boomers<br />
Last<br />
Boomers<br />
First<br />
Boomers<br />
Second<br />
Boomers<br />
Third<br />
Boomers<br />
Last<br />
Boomers<br />
(1946-50) (1951-55) (1956-60) (1961-65) (1946-50) (1951-55) (1956-60) (1961-65)<br />
All 45.0 44.0 43.2 43.0 -0.1 -0.5 -0.7 -0.7<br />
Gender<br />
Female 42.8 41.9 41.4 40.8 -0.1 -0.4 -0.6 -0.7<br />
Male 47.4 46.3 45.1 45.6 -0.2 -0.6 -0.7 -0.7<br />
Marital Status<br />
Never married 39.4 41.1 38.0 38.3 0.0 -0.6 -0.7 -0.7<br />
Married 46.7 45.3 44.1 44.3 -0.1 -0.5 -0.7 -0.7<br />
Widowed 40.3 41.6 40.8 39.7 -0.2 -0.4 -0.6 -0.7<br />
Divorced 42.7 41.8 43.1 42.4 -0.2 -0.5 -0.8 -0.8<br />
Race/Ethnicity<br />
Non-Hispanic white 49.1 48.6 48.0 47.6 -0.2 -0.6 -0.8 -0.8<br />
Non-Hispanic black 31.3 32.2 31.3 31.2 0.0 -0.5 -0.5 -0.8<br />
Hispanic 26.3 26.3 27.6 29.2 -0.1 -0.1 -0.4 -0.2<br />
Other 40.3 38.0 39.1 46.1 -0.1 -0.3 -0.4 -0.6<br />
Education<br />
High school dropout 19.2 19.0 20.1 21.0 -0.1 -0.1 -0.2 -0.3<br />
High school graduate 38.4 37.9 37.6 36.5 -0.1 -0.4 -0.6 -0.6<br />
College graduate 68.2 67.6 68.2 69.8 -0.2 -0.8 -1.2 -1.2<br />
Labor Force Experience<br />
Less than 20 years 22.2 20.7 21.8 22.0 -0.1 -0.1 -0.2 -0.2<br />
20 to 29 years 32.0 31.3 30.6 29.6 0.0 -0.1 -0.3 -0.3<br />
30 or more year 50.7 49.4 48.3 48.5 -0.2 -0.6 -0.8 -0.8<br />
Shared Lifetime Earnings<br />
1st Quintile 16.8 16.9 16.9 16.9 0.0 0.0 -0.1 -0.1<br />
2nd Quintile 29.3 27.4 27.5 26.9 -0.1 -0.1 -0.2 -0.3<br />
3rd Quintile 41.4 39.7 37.7 38.0 -0.1 -0.4 -0.5 -0.6<br />
4th Quintile 56.5 56.1 53.5 52.9 -0.2 -0.7 -0.8 -0.8<br />
5th Quintile 85.8 87.5 88.1 90.0 -0.3 -1.3 -2.0 -2.0<br />
Income Quintile<br />
1st Quintile 11.0 10.9 10.7 10.7 0.0 0.0 0.0 0.0<br />
2nd Quintile 23.3 22.6 22.1 21.8 0.0 -0.1 -0.1 -0.2<br />
3rd Quintile 36.6 35.5 34.7 33.8 -0.1 -0.3 -0.4 -0.4<br />
4th Quintile 58.0 56.9 55.3 55.0 -0.2 -0.8 -0.9 -0.9<br />
5th Quintile 110.3 111.0 110.0 112.9 -0.5 -1.5 -2.3 -2.5<br />
Note: Projections exclude individuals with family wealth in the top 5 percent of the distribution. Shared lifetime earnings is the average of wage-indexed<br />
shared earnings between ages 22 and 62, where shared earnings are computed by assigning each individual half the total earnings of the couple in the years<br />
when the individual is married and his or her own earnings in years when nonmarried.<br />
Source: Authors' computations of MINT5 (see text for details).<br />
37 The Retirement Policy Program