Indoor Air Quality - Nippon Paint Malaysia
Indoor Air Quality - Nippon Paint Malaysia
Indoor Air Quality - Nippon Paint Malaysia

You also want an ePaper? Increase the reach of your titles
YUMPU automatically turns print PDFs into web optimized ePapers that Google loves.
Collaborative Work With
Lt. M Syazwan Aizat Ismail MCIEH (PSSTLDM)<br />
Environmental and Occupational Medicine Unit<br />
Department of Community Health<br />
Faculty of Medicine and Health Sciences<br />
Universiti Putra <strong>Malaysia</strong><br />
syazwan@putra.upm.edu.my<br />
03-89472358/ 013-2823757 please sms first
• Technology Oriented • Business Driven • Sustainable Development • Environmental Friendly<br />
<strong>Indoor</strong> air TVOCs & formaldehyde<br />
monitoring programme and its impact<br />
on respiratory health, allergies, and<br />
asthma among building occupants.<br />
• Scope of presentation<br />
• Introduction of IAQ<br />
• Objective<br />
• Methodology<br />
• Result<br />
• Discussion<br />
• Recommendation & Conclusion
• Technology Oriented • Business Driven • Sustainable Development • Environmental Friendly<br />
What are the side-effects<br />
of exposure to IAP?<br />
Scientists have discovered sicknesses that are associated with the exposure to indoor air<br />
pollutants such:<br />
1. Sick Building Syndrome (SBS)*<br />
Where more than 30 percent of occupants experience adverse effects while in<br />
the building, but no clinically diagnosed disease is found.<br />
2. Building Related Illness (BRI)<br />
General term for a medically diagnosable illness caused by, or related to,<br />
building occupancy.<br />
3. Multiple Chemical Sensitivity (MCS) or Environmental Illness (EI)<br />
A controversial condition where an individual has, or develops sensitivity to,<br />
even low levels of certain chemicals due to extended exposure.
General Way to Control IAP in Office…<br />
• Technology Oriented • Business Driven • Sustainable Development • Environmental Friendly
General Way to Control IAP in Office…<br />
• Technology Oriented • Business Driven • Sustainable Development • Environmental Friendly
• Technology Oriented • Business Driven • Sustainable Development • Environmental Friendly<br />
Source of <strong>Indoor</strong> <strong>Air</strong> Pollutants?
Objective of the Study<br />
• Technology Oriented • Business Driven • Sustainable Development • Environmental Friendly<br />
• To classify and characterise the general indoor air TVOCs and<br />
formaldehyde inside different types of buildings.<br />
• To compare the indoor air TVOCs and formaldehyde level between<br />
new and old buildings.<br />
• To compare the respiratory symptoms and sick building syndrome<br />
symptoms between the different types of buildings.<br />
• To determine the association between the level of indoor air TVOCs<br />
and formaldehyde and reported symptoms among building<br />
occupants in differently designed buildings.<br />
• To characterise the risk of indoor air TVOCs and formaldehyde<br />
existing in association with allergies and asthma among building<br />
occupants.
What is our Sample?<br />
• Technology Oriented • Business Driven • Sustainable Development • Environmental Friendly<br />
• This programme covered 43 postcodes in the Klang Valley.<br />
Basically the buildings monitored covered offices, houses (landed<br />
and apartments) and public spaces in urban and village areas.<br />
• The ventilation systems - a mixture of air conditioning system<br />
(centralised and split unit), fan and open window.<br />
• All the buildings monitored were a mixture of old and new<br />
buildings covering all types of buildings (offices, houses and public<br />
spaces).
Location<br />
• Technology Oriented • Business Driven • Sustainable Development • Environmental Friendly
Design and Sampling<br />
• Technology Oriented • Business Driven • Sustainable Development • Environmental Friendly<br />
• Cross-sectional study (exposure and health effect investigated<br />
simultaneously)<br />
• This study was a pilot research which focused on four major types of<br />
buildings, namely:<br />
• private houses (landed property and apartments);<br />
• public places (library, shopping mall and others);<br />
• commercial buildings (offices and shop lots) and<br />
• offices (public / government or private).<br />
• Multi-stages systematic random sampling was deployed during the<br />
monitoring period. Buildings were selected based on determined<br />
postcodes (three examples of buildings randomly selected)
Design and Sampling<br />
• Technology Oriented • Business Driven • Sustainable Development • Environmental Friendly
• Technology Oriented • Business Driven • Sustainable Development • Environmental Friendly<br />
Sampling Method and Sample Size<br />
• Purposive sampling / universal samples<br />
• 1163 samples in Klang Valley buildings were collected<br />
• Over 400 building occupants were interviewed<br />
• Following inclusive criteria such as:<br />
• Staying in the particular indoor environment for at least 1 year;<br />
• Staying / using the indoor environment for at least 8 hours per<br />
day;<br />
• Not suffering from any chronic related diseases such as heart<br />
disease, kidney disease and mental illness
• Technology Oriented • Business Driven • Sustainable Development • Environmental Friendly<br />
FINDINGS<br />
Readings / Levels of indoor pollutants<br />
- Formaldehyde/ TVOCs<br />
- TVOCs<br />
- Temperature/ RH<br />
- <strong>Air</strong> Movement
• Technology Oriented • Business Driven • Sustainable Development • Environmental Friendly<br />
Sick Building Symptoms – indicator chronic illness<br />
Symptoms<br />
General<br />
Fatigue<br />
Feeling heavy headed<br />
Headache<br />
Nausea or dizziness<br />
Difficulty concentrating<br />
Mucosal<br />
Itching, burning, or irritation of the eyes<br />
Irritated, stuffy, or runny nose<br />
Hoarse, dry throat<br />
Cough<br />
•Related to the neurological effect<br />
•Central nervous system<br />
•Neurobehavioral effect indicator<br />
•Persistent pattern and may prolong for 4-5 days<br />
•Irritation effect to the upper respiratory system<br />
•Lower respiratory system/ systemic function from lung<br />
to blood vessels<br />
•Develop in 2-3 days before manifesting<br />
Dermal<br />
Dry or flushed facial skin<br />
Scaling or itching scalp or ears<br />
Hand dry, itching, red skin<br />
•Skin irritation effect<br />
•Physical stressor indicator/ chemical sensitivity indicator<br />
•Immediate effect on the skin contact
PPM<br />
1<br />
12<br />
23<br />
34<br />
45<br />
56<br />
67<br />
78<br />
89<br />
100<br />
111<br />
122<br />
133<br />
144<br />
155<br />
166<br />
177<br />
188<br />
199<br />
210<br />
221<br />
232<br />
243<br />
254<br />
265<br />
276<br />
287<br />
298<br />
309<br />
320<br />
331<br />
342<br />
353<br />
364<br />
375<br />
386<br />
397<br />
408<br />
419<br />
430<br />
441<br />
452<br />
463<br />
474<br />
485<br />
496<br />
507<br />
518<br />
529<br />
Result – Exceeding acceptable limit of 0.1 ppm<br />
• Technology Oriented • Business Driven • Sustainable Development • Environmental Friendly<br />
2<br />
1.9<br />
1.8<br />
1.7<br />
1.6<br />
1.5<br />
1.4<br />
1.3<br />
1.2<br />
1.1<br />
1<br />
0.9<br />
0.8<br />
0.7<br />
0.6<br />
0.5<br />
0.4<br />
0.3<br />
0.2<br />
0.1<br />
0<br />
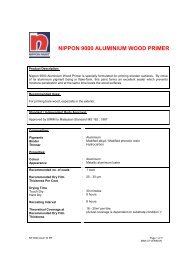
Formaldehyde Level in Different Type of Building<br />
According to DOSH the<br />
maximum limit of<br />
formaldehyde in a living<br />
space is 0.1 ppm (part per<br />
million) or 0.12mg/m 3 , any<br />
higher concentration could<br />
cause harmful effects to<br />
health.<br />
Hotel<br />
Home<br />
Public<br />
Office<br />
Mall<br />
Number of Observation<br />
Figure 3.1.2 Distribution of Formaldehyde concentration over different types<br />
of buildings versus number of observations
Result – Explanation<br />
• Technology Oriented • Business Driven • Sustainable Development • Environmental Friendly<br />
• Permissible exposure limit (PEL) regulated under OSHA cannot<br />
exceed 0.75 ppm of occupational exposure<br />
• Current research suggests 20-30% of office buildings have<br />
formaldehyde levels above the PEL standard. This is very critical as<br />
the indoor environment should not exceed occupational exposure<br />
based on the nature of the workstation<br />
How bad is formaldehyde?<br />
• Toxicological study – formaldehyde can cause irritation to the eyes,<br />
respiratory irritant effect and neurological problems<br />
• Chronic exposure can lead to upper respiratory system cancers<br />
• Irritation of the eyes and nose, and throat dryness
Toxic kinetics of formaldehyde<br />
• Technology Oriented • Business Driven • Sustainable Development • Environmental Friendly<br />
Inhalation<br />
(40-50%)<br />
Lung absorbs gases + chemicals<br />
Formaldehyde will enter the blood and thus<br />
affect the neuron function<br />
Irritation will<br />
occur to<br />
your<br />
- eyes<br />
- nose<br />
- throat<br />
But!!!<br />
-This is influenced by your:<br />
-Age (younger/ older people have<br />
poor immune system/mechanism<br />
which had poor mechanism to<br />
remove pollutants), genetics and<br />
current health status<br />
Headache, fatigue, sleeplessness,<br />
digestive symptoms such as diarrhea<br />
and unnatural thirst and menstrual<br />
irregularities (Dally et al., 1981)
• Technology Oriented • Business Driven • Sustainable Development • Environmental Friendly<br />
Result<br />
Table 3.2 Comparison of<br />
indoor air pollutant<br />
parameters between old<br />
and new buildings<br />
Temperature<br />
recorded above<br />
suggested standard<br />
regulated by DOSH<br />
Parameters New Old Statistic p-value<br />
Mean SD Mean SD<br />
Formaldehyde (ppm) 0.071 0.16 0.051 0.16 1.061 0.289<br />
TVOCs (ppm) 0.032 0.12 0.020 0.20 0.515 0.606<br />
Temperature ( 0 C) 26.37 3.88 26.74 3.30 -0.801 0.425<br />
Relative Humidity (%) 64.50 8.36 61.08 8.78 3.233* 0.001<br />
<strong>Air</strong> Movement (m/s) 0.110 0.16 0.141 0.99 -0.233 0.816<br />
Carbon Dioxide (ppm) 587.1 192.9 600.7 315.2 -0.383 0.702<br />
Result – Explanation<br />
• High formaldehyde in new buildings = new structure more hazardous<br />
compared to old buildings in most of Klang Valley areas (but, old<br />
buildings have inefficient MVAC systems = therefore formaldehyde<br />
was still captured during our investigation<br />
• Formaldehyde is influenced by the temperature, RH and ventilation
Result – Explanation<br />
• Technology Oriented • Business Driven • Sustainable Development • Environmental Friendly<br />
• High temperature as shown in old and new buildings influence the<br />
formaldehyde level indoors<br />
• Even when RH is within limit, high temperature increases the<br />
potential of chemical dispersion and accumulation effect of<br />
formaldehyde and Aldehydes compounds<br />
How bad is this issue?<br />
• Most of the buildings(≈700 building) have poor temperature<br />
control, leading to chemical dispersion especially Aldehydes<br />
containing material including formaldehyde
Result<br />
3.2.1c<br />
Formaldehyde<br />
measurement<br />
between different<br />
types of buildings<br />
Higher Formaldehyde in<br />
most of the hotel areas<br />
• Technology Oriented • Business Driven • Sustainable Development • Environmental Friendly<br />
No Item Vent System Mean Median SD Min Max Stat<br />
1. Home <strong>Air</strong>-Condition - - - - - N/A<br />
No <strong>Air</strong>-Condition 0.03 0.02 0.05 0.0 0.41<br />
2. Office <strong>Air</strong>-Condition 0.05 0.01 0.20 0.00 3.32 0.849<br />
No <strong>Air</strong>-Condition 0.03 0.03 0.04 0.00 0.05<br />
3. Public <strong>Air</strong>-Condition 0.06 0.03 0.10 0.00 0.70 0.508<br />
No <strong>Air</strong>-Condition 0.08 0.03 0.16 0.00 0.48<br />
4. Mall <strong>Air</strong>-Condition 0.08 0.01 0.16 0 1.40 N/A<br />
No <strong>Air</strong>-Condition - - - - -<br />
5. Hotel <strong>Air</strong>-Condition 0.11 0.05 0.19 0.00 1.08 0.841<br />
No <strong>Air</strong>-Condition 0.09 0.10 0.02 0.07 0.10
Result – Explanation<br />
• Technology Oriented • Business Driven • Sustainable Development • Environmental Friendly<br />
• Home exposure can go up to 0.08, but maximum exposure is 0.41ppm = not good for<br />
babies, children, and the elderly<br />
• Office exposure can go up to 0.05±0.20 = 0.25 which exceeds the limit and can cause<br />
irritation to the eyes, skin and throat. Prolonged exposure may lead to neurological effects<br />
• Public areas (healthcare, museum, library) can go up to 0.06±0.10 = 0.16 ppm. Effects<br />
similar to the office conditions can occur<br />
• Shopping malls present unhealthy indoor air and prolonged exposure can go up to<br />
0.08±0.16 = 0.24 ppm. Most huge malls/exhibition areas present a threat to common<br />
people (baby, children, elderly) and especially among those more susceptible<br />
• Hotels recorded levels above the standard set by DOSH. Staying in hotels with pure airconditioning<br />
units only can accumulate a number of hazardous pollutants in your blood<br />
thus disrupting its normal functions<br />
How bad is this issue?<br />
Samples Number Office Home Public Mall Hotel Total<br />
TOTAL 546 303 102 154 38 1163<br />
• Number of affected areas more than 60% of total categories (we are in danger of<br />
exposing ourselves to possible carcinogen agents – formaldehyde/ Aldehydes)
Result<br />
3.2.1d TVOCs<br />
measurement<br />
between different<br />
types of buildings<br />
• Technology Oriented • Business Driven • Sustainable Development • Environmental Friendly<br />
No Item Vent System Mean Median SD Min Max Stat<br />
1. Home <strong>Air</strong>-Condition - - - - - N/A<br />
No <strong>Air</strong>-Condition 0.009 0 0.43 0.43 0.03<br />
2. Office <strong>Air</strong>-Condition 0.035 0 0.30 0 5.91 0.870<br />
No <strong>Air</strong>-Condition 0 0 0 0 0<br />
3. Public <strong>Air</strong>-Condition 0.016 0 0.07 0 0.50 0.511<br />
No <strong>Air</strong>-Condition 0 0 0 0 0<br />
Highest value<br />
recorded in offices<br />
are above the<br />
suggested guideline<br />
4. Mall <strong>Air</strong>-Condition 0.013 0 0.05 0 0.28 N/A<br />
No <strong>Air</strong>-Condition - - - - -<br />
5. Hotel <strong>Air</strong>-Condition 0.044 0 0.15 0 0.83 0.610<br />
No <strong>Air</strong>-Condition 0 0 0 0 0
• Technology Oriented • Business Driven • Sustainable Development • Environmental Friendly<br />
Result – Explanation<br />
• Homes, Public Areas, Malls and Hotels have shown levels of TVOCs within the standard<br />
suggested by DOSH<br />
• However, several locations (5%) of the study population show maximum readings of TVOCs<br />
more than 3 ppm. This can trigger asthmatic symptoms for asthmatic people, irritation to<br />
the throat and eyes<br />
How bad is this issue?<br />
Samples Number Office Home Public Mall Hotel Total<br />
TOTAL 546 303 102 154 38 1163<br />
• TVOCs can cause neurobehavioral disorders<br />
• Common symptoms like “headache” highly associated with exposure to TVOCs<br />
• TVOCs may need up to 6 months to reach dilution effect – therefore, introducing<br />
TVOC will damage the indoor air quality and may require measures to manage<br />
these prolonged issues
Result<br />
3.2.1a Temperature<br />
measurement between<br />
different types of<br />
buildings (Result in<br />
Degrees Celsius)<br />
Most of the hotels<br />
recorded higher<br />
temperatures<br />
compared to other<br />
types of buildings<br />
• Technology Oriented • Business Driven • Sustainable Development • Environmental Friendly<br />
No Item Vent System Mean Median SD Min Max Stat<br />
1. Home <strong>Air</strong>-Condition 31.6 31.6 0 31.6 31.6 N/A<br />
No <strong>Air</strong>-Condition 30.7 31.1 2.02 22.5 34.70<br />
2. Office <strong>Air</strong>-Condition 24.5 24.6 2.12 17.35 32.30 0.005<br />
No <strong>Air</strong>-Condition 28.8 28.8 1.13 28.0 29.60<br />
3. Public <strong>Air</strong>-Condition 26.2 26.3 2.39 20.0 34.20 0.029<br />
No <strong>Air</strong>-Condition 28.13 28.05 2.24 24.30 30.70<br />
4. Mall <strong>Air</strong>-Condition 25.72 25.50 1.98 22.20 34.10 N/A<br />
No <strong>Air</strong>-Condition - - - - -<br />
5. Hotel <strong>Air</strong>-Condition 27.31 27.2 2.17 23.30 32.3 0.650<br />
No <strong>Air</strong>-Condition 27.9 27.3 1.40 26.9 29.5
• Technology Oriented • Business Driven • Sustainable Development • Environmental Friendly<br />
Result – Explanation<br />
• Temperature in most of the building categories are above the DOSH standard (23ºC -<br />
26ºC).<br />
• This might be due to poor maintenance of the MVAC system/ radiant heat from the<br />
outdoors/ heat generated from elsewhere. Poor management/design of outdoor radiant<br />
heat<br />
• Formaldehyde emissions and levels increase with increasing temperature<br />
• Any changes in RH and temperature (over the range) will cause chemical dispersion and<br />
poor air quality<br />
How bad is this issue?<br />
Samples Number Office Home Public Mall Hotel Total<br />
TOTAL 546 303 102 154 38 1163<br />
• High temperature related to the maintenance of AHU/ MVAC and heat sources (radiant,<br />
convection, conduction heat)<br />
• Lower temperatures lead to air stagnant effect where pollutants in the air become heavier<br />
and more difficult to be diluted by outdoor air<br />
• Split unit systems pose a threat especially when the system is not properly operated/ heat<br />
not estimated very well
Result<br />
3.2.1b Relative humidity<br />
measurement between<br />
different types of<br />
buildings<br />
• Technology Oriented • Business Driven • Sustainable Development • Environmental Friendly<br />
No Item Vent System Mean Median SD Min Max Stat<br />
1. Home <strong>Air</strong>-Condition 63.1 63.1 0 63.1 63.1 N/A<br />
No <strong>Air</strong>-Condition 30.68 31.05 12.2 34.7 2.02<br />
2. Office <strong>Air</strong>-Condition 58.69 58.0 7.98 30.0 79.0 0.894<br />
No <strong>Air</strong>-Condition 65.3 65.3 16.40 53.70 76.90<br />
3. Public <strong>Air</strong>-Condition 56.62 57.00 7.41 41.0 73.90 0.000<br />
RH higher in hotels<br />
(higher than the<br />
recommended<br />
standard)<br />
No <strong>Air</strong>-Condition 68.37 65.55 7.21 60.70 74.90<br />
4. Mall <strong>Air</strong>-Condition 59.26 59.10 7.70 44.00 84.90 N/A<br />
No <strong>Air</strong>-Condition - - - - -<br />
5. Hotel <strong>Air</strong>-Condition 63.95 65.45 8.86 48.00 80.00 0.033<br />
No <strong>Air</strong>-Condition 75.63 77.70 6.83 68.00 81.20
• Technology Oriented • Business Driven • Sustainable Development • Environmental Friendly<br />
Result – Explanation<br />
• High relative humidity (RH) leads to condensation, causing air to become damp/stuffy. This<br />
stuffiness makes it difficult for chemicals to be removed from the indoor environment<br />
• Formaldehyde emissions and levels increase with the increase of relative humidity<br />
• RH in hotels ≈75% possibly due to water vapour (from outside/making coffee inside hotel<br />
room/ vapour from the hot water bath). If it increases by another 25%, it becomes<br />
saturated and condensates, forming water. Thus making it difficult for chemicals to be<br />
exhausted.<br />
• Poor MVAC maintenance and fresh air supply leads to neurological problems caused by<br />
chronic exposure<br />
How bad is this issue?<br />
Samples Number Office Home Public Mall Hotel Total<br />
TOTAL 546 303 102 154 38 1163<br />
• High RH also related to the growth of microbial biohazard agents<br />
• Some microbes will produce allergic VOCs called Microbial Volatile Organic Compounds<br />
(MVOCs) which will affect your throat and upper respiratory tract even in acute exposure<br />
• MVOCs will cause allergic rhino sinusitis and chronic skin rashes<br />
• Most Hotels investigated were “4-6 Star” hotels
Result<br />
3.2.1g <strong>Air</strong> movement<br />
measurement between<br />
different types of buildings<br />
• Technology Oriented • Business Driven • Sustainable Development • Environmental Friendly<br />
No Item Vent System Mean Median SD Min Max Stat<br />
1. Home <strong>Air</strong>-Condition 0.07 0.07 0 0.07 0.07 N/A<br />
No <strong>Air</strong>-Condition 0.33 0.17 1.79 0 31.0<br />
2. Office <strong>Air</strong>-Condition 0.06 0 0.099 0 0.61 0.127<br />
No <strong>Air</strong>-Condition 0.17 0.17 0.24 0 0.34<br />
Poor air-movement<br />
(stagnant air<br />
effect) found in<br />
most buildings<br />
3. Public <strong>Air</strong>-Condition 0.05 0 0.0939 0 0.46 0.193<br />
No <strong>Air</strong>-Condition 0.10 0.025 0.126 0 0.28<br />
4. Mall <strong>Air</strong>-Condition 0.08 0.01 0.11 0 0.44 N/A<br />
No <strong>Air</strong>-Condition - - - - -<br />
5. Hotel <strong>Air</strong>-Condition 0.04 0 0.11 0 0.56 0.090<br />
No <strong>Air</strong>-Condition 0.19 0.19 0.042 0.16 0.22
• Technology Oriented • Business Driven • Sustainable Development • Environmental Friendly<br />
Result – Explanation<br />
• Low air movement suggests stagnant air occurs in most air-conditioned buildings<br />
• CO 2 as the ventilation indicator shows the well mixing of outdoor air and return air.<br />
However, poor dilution happens indoors in most locations due to low air movement<br />
creating a “dead space episode”<br />
• Ventilation conditions influence chemical indoor dispersion eg. Formaldehyde (lowest levels<br />
are experienced in cold conditions and the infiltration rates are high on warm days or when<br />
occupants open windows).<br />
• Sufficient air movement is needed to “drive” the air from positive spaces to negative<br />
spaces, thus diluting indoor pollutants.<br />
• Formaldehyde (HCHO) concentration depends on the potency of HCHO-emitting products<br />
present, the extent of their use, the loading factor (m 2 /m 2 ) determined by surface area<br />
(m 2 ) of HCHO-emitting materials vs. volume (m 2 ) of interior space.<br />
• Small spaces have poor air-movement, poor dilution, high risk of sickness, localised<br />
symptoms.<br />
How bad is this issue?<br />
Samples Number Office Home Public Mall Hotel Total<br />
TOTAL 546 303 102 154 38 1163<br />
• HCHO is easily diluted by sufficient ventilation and air movement. Poor air “drive” causes air<br />
travel to be inconsistent (back-draft episode) – pollutants coming back
Result<br />
3.2.2 Exposure of indoor<br />
air pollutants between<br />
types of buildings either<br />
private or public buildings<br />
• Technology Oriented • Business Driven • Sustainable Development • Environmental Friendly<br />
No Parameter Space Type Mean Median SD Min Max Stat<br />
1. Formaldehyde Private 0.04 0.01 0.16 0 3.32 0.004<br />
Public 0.07 0.02 0.14 0 1.40<br />
2. TVOC Private 0.021 0 0.23 0 5.91 0.783<br />
Public 0.017 0 0.07 0 0.83<br />
3. Temperature Private 26.9 26.2 3.64 17.35 34.7 0.001<br />
Public areas show<br />
significant higher<br />
levels of<br />
formaldehyde<br />
compared to private<br />
buildings<br />
Public 26.1 26.1 2.264 20.0 34.20<br />
4. Relative humidity Private 65.2 61.9 46.64 30 788.7 0.016<br />
Public 58.9 58.9 8.27 41 84.9<br />
5. Carbon dioxide Private 551.4 505.5 257.6 348 5599 p
• Technology Oriented • Business Driven • Sustainable Development • Environmental Friendly<br />
Result – Explanation<br />
• Private = Houses, Private office; Public = Mall, Library, Museum, Clinic and Government<br />
Office<br />
• Public areas (such as government offices) recorded higher levels of formaldehyde<br />
compared to private offices 0.07 vs 0.04 ppm ≈ Public areas recorded levels twice as high<br />
as private offices (complaints among staff of government offices higher compared to those<br />
in private sector)<br />
• High temperature in Private areas compared to Public (potential of chemical dispersion will<br />
be greater in both types due to existing high level of air temperature readings)<br />
• Low air movement in Public buildings explain the higher level of formaldehyde accumulated<br />
indoors<br />
• Formaldehyde = temperature + RH + ventilation (air-movement) + space
Result<br />
Table 3.3<br />
Classification of<br />
the High and Low<br />
pollutants<br />
according to<br />
levels<br />
• Technology Oriented • Business Driven • Sustainable Development • Environmental Friendly<br />
Parameter Mean/ Median Classification<br />
Temperature 26.72 0 C Higher than Mean = High<br />
Lower than Mean = Low<br />
Relative Humidity 61.28 % Higher than Mean = High<br />
Lower than Mean = Low<br />
Carbon Dioxide ≈ 600 ppm Higher than Mean = High<br />
Lower than Mean = Low<br />
Formaldehyde ≈ 0.02 ppm Higher than Median = High<br />
Lower than Median = Low<br />
Ozone 0.01 ppm Higher than Median = High<br />
Lower than Median = Low<br />
TVOCs 0.02 ppm Higher than Median = High<br />
Lower than Median = Low<br />
Carbon Monoxide 1.2 ppm Higher than Median = High<br />
Lower than Median = Low<br />
Respirable Particulate 0.05 mg/m 3 Higher than Median = High<br />
Lower than Median = Low<br />
<strong>Air</strong> Movement 0.03 m/s Higher than Median = High<br />
Lower than Median = Low
Result<br />
50<br />
45<br />
40<br />
35<br />
30<br />
25<br />
20<br />
15<br />
10<br />
5<br />
0<br />
44.6<br />
36.7<br />
36.7 36.1<br />
• Technology Oriented • Business Driven • Sustainable Development • Environmental Friendly<br />
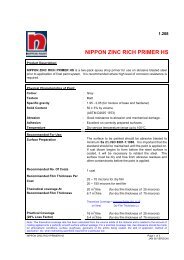
Association between high formaldehyde levels and positive<br />
reported symptoms (<strong>Malaysia</strong> vs. Scandinavia)<br />
29.5<br />
18.4<br />
16.3 15.3<br />
24.7<br />
19.3<br />
24.7 25.6<br />
22.5<br />
20.5 19.9<br />
16.9<br />
26.5<br />
10.7<br />
19.5 20.2 20<br />
16.9<br />
10.8 11.4<br />
Higher prevalence<br />
compared to<br />
European<br />
problematic<br />
buildings<br />
Positive reported symptoms (%)<br />
Scandinavian Problematic Building<br />
3.3.2 Association between formaldehyde levels (0.02ppm as cut of point)<br />
and positive reported symptoms (YES) compared to external references<br />
(Swedish Problematic Buildings)
• Technology Oriented • Business Driven • Sustainable Development • Environmental Friendly<br />
Result – Explanation<br />
• Formaldehyde causes higher prevalence of General Symptoms such as “Headaches”,<br />
Neurological symptoms (Dizziness/ Nausea) and respiratory irritants (cough).<br />
• High formaldehyde exposure results in dermal and general symptoms complaints.<br />
• Klang Valley current indoor air status is worse than the most problematic buildings<br />
overseas. There is an urgent need to raise awareness about indoor air pollutants to protect<br />
occupants from prolonged and chronic exposure. This exposure is possibly causing high<br />
reported non-communicable diseases such as migraine, severe headache, brain cancer and<br />
lung cancer.<br />
• Exposure to formaldehyde suggests that even levels set at 0.02 ppm can trigger minor<br />
health complaints among building occupants. Therefore, exposure of up to 0.1 ppm (DOSH<br />
standard) are a threat to our long term health especially on the neurological system.
Result<br />
50<br />
45<br />
40<br />
35<br />
30<br />
25<br />
20<br />
15<br />
10<br />
5<br />
0<br />
44.3<br />
36.7<br />
38.5<br />
35.7<br />
• Technology Oriented • Business Driven • Sustainable Development • Environmental Friendly<br />
Association between high temperature levels and reported symptoms<br />
(<strong>Malaysia</strong> vs. Scandinavia)<br />
29.5<br />
18.4<br />
17.2<br />
15.3<br />
24.9<br />
19.3<br />
24.7 25.6<br />
19 20.4 20.8<br />
22.5<br />
23.5<br />
10.7<br />
16.3<br />
19.5 20.2 20<br />
12.2 13.1<br />
Higher prevalence of<br />
“General Symptoms”<br />
Positive reported symptoms (%)<br />
Scandinavian Problematic Building<br />
3.3.1 Association between temperature and positive reported symptoms<br />
(YES) compared to external references (Swedish Problematic Buildings)
• Technology Oriented • Business Driven • Sustainable Development • Environmental Friendly<br />
Result – Explanation<br />
• Data shows temperature in most of the areas are above the range suggested by DOSH<br />
• Dry air was a common complaint among most workers (result not shown), this reflects<br />
efficiency issues of the MVAC system<br />
• High temperature (more than 26.7 o C) being hypothetical testing for high and low level of<br />
temperature<br />
• More complaints about Mucosal symptoms (Cough) among <strong>Malaysia</strong>ns compared to<br />
Problematic Buildings (elsewhere)<br />
• “General Site/Symptoms” higher among <strong>Malaysia</strong>ns in non-industrial workplace (office<br />
workers)<br />
• Even in temperatures of 26.7 o C, more than 6 symptoms (50% of SBS symptoms) have the<br />
possibility of affecting workers in indoor environments<br />
• High temperatures associated with high prevalence of headache, heavy head, nausea,<br />
dizziness that leads to absenteeism among <strong>Malaysia</strong>ns. This probably leads to high medical<br />
bills and thus reduces motivation to work.
Result<br />
50<br />
45<br />
40<br />
35<br />
30<br />
25<br />
20<br />
15<br />
10<br />
5<br />
0<br />
44<br />
36.7<br />
37.6 36.2<br />
• Technology Oriented • Business Driven • Sustainable Development • Environmental Friendly<br />
Association between RH level and reported symptoms (<strong>Malaysia</strong> vs.<br />
Scandinavia)<br />
29.5<br />
18.4<br />
17<br />
15.3<br />
25.5<br />
19.3<br />
24.7 25.6<br />
21.6 22.3 22.3 22.5<br />
24.8<br />
10.7<br />
18.8 19.5 20.2 20<br />
14.9 14.2<br />
Higher<br />
prevalence of<br />
“General<br />
Symptoms” +<br />
Mucosal<br />
Positive reported symptoms (%)<br />
Scandinavian Problematic Building<br />
3.3.2 Association between Relative Humidity (RH) and positive reported<br />
symptoms (YES) compared to external references (Swedish Problematic Buildings)
• Technology Oriented • Business Driven • Sustainable Development • Environmental Friendly<br />
Result – Explanation<br />
• Clear relative relationship between temperature and relative humidity which has a similar<br />
pattern of complaints like exposure to high temperature<br />
• RH was set for at least 61.28% and showed high prevalence. However, no positive<br />
association between this level.<br />
• This indicates that a level of below 70% is a must to ensure the SBS symptoms can be<br />
prevented (and also chronic illness)<br />
• RH and temperature are positively correlated and therefore controlling these parameters is<br />
essential to ensure that the indoor environment is safe and at a healthy level.<br />
• If the RH and temperature is not well-controlled, chemical dispersion will occur and the<br />
accumulation effect/ stagnant pollutant episode will occur indoors.
• Technology Oriented • Business Driven • Sustainable Development • Environmental Friendly<br />
R E S U L T S<br />
Complaints of Illness/ Disorder<br />
(Office)
Result<br />
• Technology Oriented • Business Driven • Sustainable Development • Environmental Friendly<br />
Subjective Perception in Office Environment<br />
(N= 200)<br />
Water Damage<br />
15<br />
New Wall Covering<br />
11.5<br />
New Partition<br />
19.5<br />
Most<br />
occupants<br />
complained<br />
about strong<br />
odours<br />
New Furniture<br />
New Carpet<br />
Strong Odor<br />
13<br />
18.5<br />
86<br />
%<br />
Carpet<br />
48.5<br />
0 10 20 30 40 50 60 70 80 90 100
• Technology Oriented • Business Driven • Sustainable Development • Environmental Friendly<br />
Result<br />
30<br />
Reported Illness diagnose by Doctor (Yes Only)<br />
28.5<br />
25<br />
23<br />
23.7<br />
20.8<br />
20<br />
Differences in<br />
prevalence of<br />
disease/ illness:<br />
- higher in offices<br />
compared to homes<br />
(offices showed<br />
health related risk<br />
that could influence<br />
workers condition)<br />
15<br />
10<br />
5<br />
0<br />
16<br />
7.5<br />
15<br />
1.4 1.4<br />
16.5<br />
7.5<br />
9<br />
14.5<br />
8.5<br />
10<br />
8.5<br />
12.6<br />
8<br />
Offices<br />
Houses
• Technology Oriented • Business Driven • Sustainable Development • Environmental Friendly<br />
Result – Explanation<br />
• More complaints/ reported illness from offices compared to<br />
houses suggests that the indoor workplace has greater risks<br />
• However, houses also posed the same risk of exposure due to the<br />
fact that we spend at least 8 hours in our houses. 5% of<br />
complaints = 10 – 11 occurrences of illnesses in houses.
Result<br />
Table 3.1.1g. Differences<br />
in Reported <strong>Indoor</strong> <strong>Air</strong><br />
Symptoms Among<br />
Government and Private<br />
Buildings (male and<br />
• Technology Oriented • Business Driven • Sustainable Development • Environmental Friendly<br />
14<br />
12<br />
10<br />
8<br />
6<br />
4<br />
2<br />
Differences in Reported <strong>Indoor</strong> <strong>Air</strong> Symptoms<br />
Among Government and Private Buildings<br />
female respondents) 0<br />
Government staff<br />
had more<br />
complaints than<br />
private sector staff<br />
(risk level = 4-6<br />
times higher)<br />
Government<br />
Private
• Technology Oriented • Business Driven • Sustainable Development • Environmental Friendly<br />
Result – Explanation<br />
• Public servants have a higher potential of falling ill compared to private workers<br />
• However, the risk of developing illnesses is similar<br />
• Gender is also a factor with illnesses caused by the indoor environment (twice as high<br />
between female and male)
• Technology Oriented • Business Driven • Sustainable Development • Environmental Friendly<br />
R E S U L T S<br />
Complaints / Symptoms<br />
(Dwellings)
Result<br />
60<br />
• Technology Oriented • Business Driven • Sustainable Development • Environmental Friendly<br />
Reported Illnesses diagnosed by doctor<br />
in different types of dwellings<br />
56.3<br />
50<br />
40<br />
37.5<br />
37.5<br />
40<br />
Sinus, Migraine and<br />
Eczema prominent<br />
among single home<br />
occupants.<br />
30<br />
20<br />
10<br />
0<br />
25<br />
20.4<br />
15.2<br />
6.3 6.3 6.3<br />
3.1 3.1<br />
0 1 1.3<br />
0 1 1.3<br />
13.9<br />
Table 3.1.3d. Reported Illness diagnosed by doctor<br />
in different types of dwellings<br />
20<br />
18.8<br />
10.1 10 10.1<br />
6.1 6.1<br />
Sinus Pneumonia Tuberculosis Asthma Migraine Eczema Allergy To<br />
Dust<br />
18.4<br />
Single Home (n) Farm (n) Apartment (n) Detached (n)<br />
22.8<br />
6.3<br />
25<br />
18.8<br />
15<br />
7.6<br />
5.1<br />
3.8 4.1<br />
Allergy To<br />
Mold<br />
Allergy To Pet
• Technology Oriented • Business Driven • Sustainable Development • Environmental Friendly<br />
Result – Explanation<br />
• Single home owners (bungalows) reported higher prevalence of reported illnesses<br />
compared to other types of houses<br />
• Single houses are usually equipped with air-conditioning units and most houses<br />
investigated contained a number of chemical dispersion agents (formaldehyde, TVOCs/<br />
Aldehydes) possibly emitted during high temperature conditions (when A/C not running)<br />
• This condition becomes worse when most of the single houses over decorate with various<br />
“indoor culprits” such as wall paper, furnishings and fragrances.<br />
• When these houses do not have sufficient air-movement/natural ventilation, chemicals be<br />
will stagnant inside the house
Result<br />
Table 3.1.3c.<br />
Reported subjective<br />
health complaints<br />
(Reported Severe and<br />
Moderate Condition)<br />
Most occupants<br />
complained about<br />
respiratory illness/<br />
condition and<br />
neurological<br />
disturbance (due to<br />
chemicals)<br />
• Technology Oriented • Business Driven • Sustainable Development • Environmental Friendly<br />
20<br />
18<br />
16<br />
14<br />
12<br />
10<br />
8<br />
6<br />
4<br />
2<br />
0<br />
17.9<br />
14.1<br />
6.8<br />
Reported subjective health complaints<br />
(Reported Severe and Moderate Condition)%<br />
14.2<br />
9.9<br />
11.7<br />
6<br />
8.9<br />
7.3<br />
3.8 3.3<br />
3.8 3.4 2.9<br />
3.6<br />
6.8<br />
4.1<br />
2.4<br />
3.4<br />
6.6<br />
5.6<br />
12.6<br />
7.2<br />
6.1<br />
8.8
• Technology Oriented • Business Driven • Sustainable Development • Environmental Friendly<br />
Result – Explanation<br />
• This study also adopted subjective health complaint questions<br />
• Based on the findings, most occupants complained about upper respiratory conditions,<br />
neurological disturbances and psychological issues (tiredness).<br />
• This suggests the correlation between indoor chemistry and the reported complaints<br />
which significantly correlates exposure and health effects.
• Technology Oriented • Business Driven • Sustainable Development • Environmental Friendly<br />
R E S U L T S<br />
Complaints of Illness/ Disorder<br />
(Overall)
Result – Explanation<br />
• Temperature plays an important<br />
role in influencing reported<br />
illnesses<br />
• This episode occurs due to the<br />
fact that most of the pollutants<br />
are influenced by temperature<br />
changes and relative humidity<br />
• Technology Oriented • Business Driven • Sustainable Development • Environmental Friendly<br />
Illness Level of Pollutants Frequency % Stats<br />
Sinus High 40 18.1 0.514<br />
Low 31 17.7<br />
Pneumonia High 4 1.8 0.003<br />
Low 14 8.0<br />
Tuberculosis High 8 3.6 p
• Technology Oriented • Business Driven • Sustainable Development • Environmental Friendly<br />
Result<br />
3.4.1 Association<br />
between exposure to<br />
level of temperature and<br />
the reported illness<br />
9%<br />
8%<br />
21%<br />
Sinus<br />
Pneumonia<br />
Temperature has<br />
important effect on<br />
the reported<br />
illnesses among<br />
occupants.<br />
Temperature affects<br />
chemical dispersion,<br />
chemical odour, etc.<br />
24%<br />
10%<br />
14%<br />
8%<br />
2%<br />
4%<br />
Tuberculosis<br />
Asthma<br />
Migraine<br />
Eczema<br />
Dust allergy<br />
Mold Allergy<br />
Pets Allergy
• Technology Oriented • Business Driven • Sustainable Development • Environmental Friendly<br />
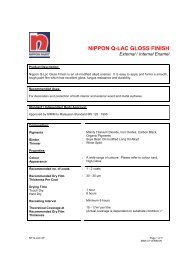
Result<br />
30<br />
3.4.3 Association<br />
between exposure to<br />
formaldehyde and the<br />
reported illnesses<br />
25<br />
20<br />
Sinus , 18.7<br />
Migraine , 19.9<br />
Dust allergy , 26.5<br />
At level 0.02ppm, there<br />
was significant<br />
association between<br />
level of formaldehyde<br />
dispersion and reported<br />
diagnosed migraine<br />
among respondents<br />
(≈20%).<br />
15<br />
10<br />
5<br />
Pneumonia , 4.8<br />
Tuberculosis , 7.2<br />
Asthma , 12.7<br />
Eczema , 12<br />
Mold Allergy , 8.4<br />
Pets Allergy , 10.2<br />
0
• Technology Oriented • Business Driven • Sustainable Development • Environmental Friendly<br />
Result – Explanation<br />
• Emission of formaldehyde shows a median of 0.02 ppm, thus this level was tested for<br />
hypothesis linkage in association with the reported illness.<br />
• Results indicate 20% of respondents complained about having migraine with exposure as<br />
low as 0.02 ppm (current state).<br />
• This indicates that even low levels of emission (>0.02 ppm) can influence the development<br />
of neurological disorders explainable by statistical analysis and epidemiological evidence<br />
• Based on predicted values, exposure of more than 0.06 ppm can potentially give occupants<br />
preliminary irritant symptoms first then if the exposure continues, the chronic exposure<br />
will lead to neurological changes<br />
• Chemical management indoors should be emphasized to reduce this potential disease/<br />
disorders and ensure public health and safety
Discussion<br />
Sources<br />
• Technology Oriented • Business Driven • Sustainable Development • Environmental Friendly<br />
Temperature<br />
Relative<br />
Humidity<br />
Ventilation<br />
FORMALDEHYDE/<br />
INDOOR<br />
CHEMISTRY<br />
Spaces<br />
Absenteeism<br />
Health Effects<br />
<strong>Quality</strong> of Life<br />
Change<br />
Productivity<br />
Medical Bills<br />
Chronic Diseases
• Technology Oriented • Business Driven • Sustainable Development • Environmental Friendly<br />
Conclusion – Controlling Exposure - 1<br />
Elimination<br />
• Remove all potential chemicals that<br />
emit strong odours<br />
• Look carefully at MSDS<br />
Isolation<br />
Substitution<br />
• Store chemicals in proper place<br />
• Keep away from area with potential<br />
heat/ warmth<br />
• Choose materials/ substances wisely<br />
(eco-friendly) – Green Products<br />
• Alter/ choose mechanism that limit<br />
overexposure – artistic but healthy
• Technology Oriented • Business Driven • Sustainable Development • Environmental Friendly<br />
Conclusion – Controlling Exposure - 2<br />
Engineering<br />
• Maintenance of MVAC system<br />
• Flushing of indoor areas before<br />
occupying/ Pre-testing<br />
Administrative<br />
Personal Protective<br />
Equipment<br />
• Conduct independent testing for<br />
assessing indoor air pollutants level<br />
• Housekeeping after work/ prescribe<br />
activities not during working period<br />
• Establish complaint mechanism<br />
• Protect yourself when potentially in<br />
high risk of exposure (strong odour)
Are Green Products Healthy?<br />
Yes, Green products help to maintain the<br />
health of occupants for prolonged time, thus<br />
limiting the risk of exposure to hazardous<br />
substances
Thank You