2010 Annual Report - the Seashore Trolley Museum
2010 Annual Report - the Seashore Trolley Museum
2010 Annual Report - the Seashore Trolley Museum

Create successful ePaper yourself
Turn your PDF publications into a flip-book with our unique Google optimized e-Paper software.
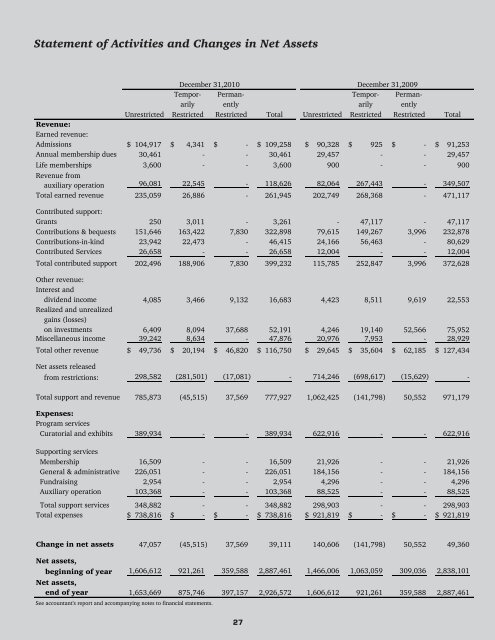
Statement of Activities and Changes in Net Assets<br />
<strong>2010</strong> <strong>Annual</strong> <strong>Report</strong><br />
December 31,<strong>2010</strong> December 31,2009<br />
Tempor- Perman- Tempor- Permanarily<br />
ently arily ently<br />
Unrestricted Restricted Restricted Total Unrestricted Restricted Restricted Total<br />
Revenue:<br />
Earned revenue:<br />
Admissions $ 104,917 $ 4,341 $ - $ 109,258 $ 90,328 $ 925 $ - $ 91,253<br />
<strong>Annual</strong> membership dues 30,461 - - 30,461 29,457 - - 29,457<br />
Life memberships 3,600 - - 3,600 900 - - 900<br />
Revenue from<br />
auxiliary operation 96,081 22,545 - 118,626 82,064 267,443 - 349,507<br />
Total earned revenue 235,059 26,886 - 261,945 202,749 268,368 - 471,117<br />
Contributed support:<br />
Grants 250 3,011 - 3,261 - 47,117 - 47,117<br />
Contributions & bequests 151,646 163,422 7,830 322,898 79,615 149,267 3,996 232,878<br />
Contributions-in-kind 23,942 22,473 - 46,415 24,166 56,463 - 80,629<br />
Contributed Services 26,658 - - 26,658 12,004 - - 12,004<br />
Total contributed support 202,496 188,906 7,830 399,232 115,785 252,847 3,996 372,628<br />
O<strong>the</strong>r revenue:<br />
Interest and<br />
dividend income 4,085 3,466 9,132 16,683 4,423 8,511 9,619 22,553<br />
Realized and unrealized<br />
gains (losses)<br />
on investments 6,409 8,094 37,688 52,191 4,246 19,140 52,566 75,952<br />
Miscellaneous income 39,242 8,634 - 47,876 20,976 7,953 - 28,929<br />
Total o<strong>the</strong>r revenue $ 49,736 $ 20,194 $ 46,820 $ 116,750 $ 29,645 $ 35,604 $ 62,185 $ 127,434<br />
Net assets released<br />
from restrictions: 298,582 (281,501) (17,081) - 714,246 (698,617) (15,629) -<br />
Total support and revenue 785,873 (45,515) 37,569 777,927 1,062,425 (141,798) 50,552 971,179<br />
Expenses:<br />
Program services<br />
Curatorial and exhibits 389,934 - - 389,934 622,916 - - 622,916<br />
Supporting services<br />
Membership 16,509 - - 16,509 21,926 - - 21,926<br />
General & administrative 226,051 - - 226,051 184,156 - - 184,156<br />
Fundraising 2,954 - - 2,954 4,296 - - 4,296<br />
Auxiliary operation 103,368 - - 103,368 88,525 - - 88,525<br />
Total support services 348,882 - - 348,882 298,903 - - 298,903<br />
Total expenses $ 738,816 $ - $ - $ 738,816 $ 921,819 $ - $ - $ 921,819<br />
Change in net assets 47,057 (45,515) 37,569 39,111 140,606 (141,798) 50,552 49,360<br />
Net assets,<br />
beginning of year 1,606,612 921,261 359,588 2,887,461 1,466,006 1,063,059 309,036 2,838,101<br />
Net assets,<br />
end of year 1,653,669 875,746 397,157 2,926,572 1,606,612 921,261 359,588 2,887,461<br />
See accountant's report and accompanying notes to financial statements.<br />
27