Low Crest Factor Modulation Techniques for Orthogonal Frequency ...
Low Crest Factor Modulation Techniques for Orthogonal Frequency ...
Low Crest Factor Modulation Techniques for Orthogonal Frequency ...

Create successful ePaper yourself
Turn your PDF publications into a flip-book with our unique Google optimized e-Paper software.
Ubiquitous Computing and Communication Journal<br />
spectral efficiency increase as M increase. This is<br />
shown in figure 3.<br />
It is also noticeable from figure (3) that the<br />
Bandwidth of MSK is nearly the same as that of<br />
QPSK, but with lower power.<br />
Dens ity<br />
ranges in [-4δ, 4δ], this can be a good indicator <strong>for</strong><br />
clipping efficiency.<br />
BER BER<br />
0<br />
10<br />
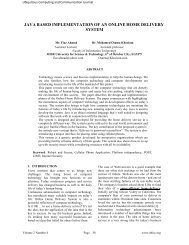
When analyzing the statistical properties of the -2<br />
10<br />
OFDM composite time signal we deduced the<br />
following: As shown in figure (4); The probability<br />
density function of the absolute OFDM signal agrees -4<br />
10<br />
with the Rayleigh distribution <strong>for</strong> all used<br />
modulation techniques.<br />
0.167<br />
1<br />
-6<br />
pdf of absolute values of OFDM signal 10<br />
16-QAM<br />
0 32-QAM<br />
4,16,32-PSK<br />
8-PSK<br />
8-QAM<br />
16-QAM<br />
16-PSK<br />
-8<br />
10<br />
0 2 4 6 8 10 12 14 16 18<br />
/N (dB)<br />
0.83<br />
E b 0<br />
0.67<br />
0.5<br />
0.33<br />
0.167<br />
0<br />
-4<br />
10<br />
0 0.2 0.4 0.6 0.8 1 1.2 1.4 1.6<br />
Data<br />
Fig.(4) PDF of OFDM with different modulation<br />
And in agreement with figure (3), as M-increases in<br />
M-QAM the dynamic range increases, and in the<br />
case of MSK the dynamic range is less than that of<br />
QPSK.<br />
Table I. Shows PAR, standard deviation δ and the<br />
dynamic range of the OFDM signal with the above<br />
mentioned modulation techniques<br />
MOD<br />
TABLE I.<br />
PAR AND STD OF OFDM SIGNAL<br />
PAR<br />
(dB)<br />
STD (δ)<br />
Absolute signal range<br />
MSK 8.3902 0.0427 0.0642<br />
QPSK 8.7001 0.0562 0.0912≡ MSK + 3 dB<br />
8QAM 9.0063 0.0965 0.1470≡ QPSK +4 dB<br />
16QAM 9.2989 0.1247 0.2213≡ 8QAM +3.5 dB<br />
32QAM 10.082 0.1777 0.2780≡ 16QAM +2 dB<br />
It is again in agreement with the above results. It<br />
is clear that although the PAR reduction due to the<br />
use of MSK instead of QPSK is slightly small, the<br />
true gain is the reduction in the dynamic range by 3<br />
dB, which enables us to use a low linearity and high<br />
efficiency power amplifiers. In addition a new<br />
indicator arises in the table which is the standard<br />
deviation δ, it is obvious from the table that MSK has<br />
the lowest δ while <strong>for</strong> M-QAM, as M increase δ<br />
increases also, since we can deal with OFDM signal<br />
as a narrow band Gaussian noise with a mean of zero<br />
and variance of δ 2 , then 68% of amplitude values<br />
ranges in [-δ,δ] and 99.994% of amplitude values<br />
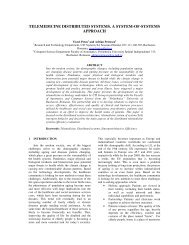
Fig.(5-a)BER of OFDM using 8,16 -PSK&QAM<br />
0<br />
10<br />
10 -2<br />
-6<br />
10<br />
32-QAM<br />
32-PSK<br />
64-QAM<br />
-8<br />
10<br />
0 2 4 6 8 10 12 14 16 18<br />
E /N (dB)<br />
b 0<br />
Fig.(5-b) BER of OFDM using 32,64 -PSK&QAM<br />
Regarding to the BER per<strong>for</strong>mance of the used<br />
modulation techniques, it is clear from figure (5-a )<br />
and (5-b) that, <strong>for</strong> M-PSK and M-QAM, the BER<br />
increases ad M increase while <strong>for</strong> the same M the<br />
BER of M-PSK is larger than that of M-QAM <strong>for</strong><br />
the same E b /N o .<br />
4. THE EFFECT OF POWER AMPLIFIERS<br />
Due to the nature of OFDM signal generation,<br />
as we mentioned above, signals have large crest<br />
factor CF, which set a demand <strong>for</strong> linearity. PAs are<br />
divided into classes according to the biasing used,<br />
the most common used amplifier classes are A, B<br />
and C.<br />
Class A amplifiers are the most linear among all<br />
classes, but with the lowest efficiency (50% at<br />
maximum). This poor efficiency causes high power<br />
consumption, which leads to worming in physical<br />
devices, and short battery life <strong>for</strong> mobile users. To<br />
achieve a better efficiency class B or C amplifiers<br />
are used but this costs a worse linearity. The high<br />
demands on linearity make class B or C unsuitable<br />
<strong>for</strong> OFDM systems. In practical applications of<br />
OFDM using QAM modulators, the amplifier is a<br />
compromise between class A and B, it is called class<br />
AB amplifier. NLA Model used <strong>for</strong> OFDM system<br />
is Rapp’s SSPA with characteristic [7]:<br />
Volume 2 Number 5 Page 113 www.ubicc.org