short version of the report for young people - Unicef UK
short version of the report for young people - Unicef UK
short version of the report for young people - Unicef UK

Create successful ePaper yourself
Turn your PDF publications into a flip-book with our unique Google optimized e-Paper software.
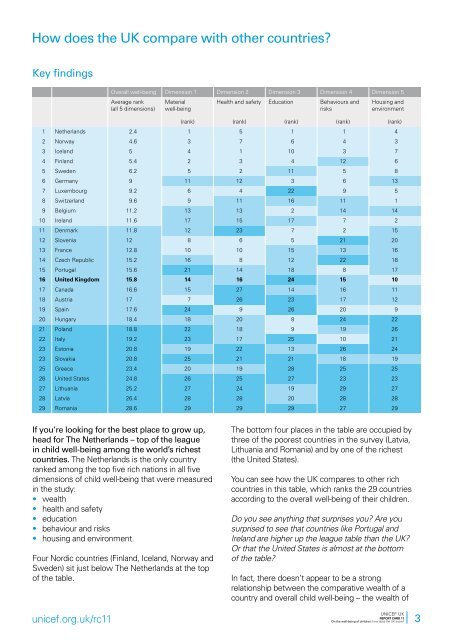
How does <strong>the</strong> <strong>UK</strong> compare with o<strong>the</strong>r countries?<br />
Key findings<br />
Overall well-being Dimension 1 Dimension 2 Dimension 3 Dimension 4 Dimension 5<br />
Average rank<br />
(all 5 dimensions)<br />
Material<br />
well-being<br />
Health and safety Education Behaviours and<br />
risks<br />
Housing and<br />
environment<br />
(rank) (rank) (rank) (rank) (rank)<br />
1 Ne<strong>the</strong>rlands 2.4 1 5 1 1 4<br />
2 Norway 4.6 3 7 6 4 3<br />
3 Iceland 5 4 1 10 3 7<br />
4 Finland 5.4 2 3 4 12 6<br />
5 Sweden 6.2 5 2 11 5 8<br />
6 Germany 9 11 12 3 6 13<br />
7 Luxembourg 9.2 6 4 22 9 5<br />
8 Switzerland 9.6 9 11 16 11 1<br />
9 Belgium 11.2 13 13 2 14 14<br />
10 Ireland 11.6 17 15 17 7 2<br />
11 Denmark 11.8 12 23 7 2 15<br />
12 Slovenia 12 8 6 5 21 20<br />
13 France 12.8 10 10 15 13 16<br />
14 Czech Republic 15.2 16 8 12 22 18<br />
15 Portugal 15.6 21 14 18 8 17<br />
16 United Kingdom 15.8 14 16 24 15 10<br />
17 Canada 16.6 15 27 14 16 11<br />
18 Austria 17 7 26 23 17 12<br />
19 Spain 17.6 24 9 26 20 9<br />
20 Hungary 18.4 18 20 8 24 22<br />
21 Poland 18.8 22 18 9 19 26<br />
22 Italy 19.2 23 17 25 10 21<br />
23 Estonia 20.8 19 22 13 26 24<br />
23 Slovakia 20.8 25 21 21 18 19<br />
25 Greece 23.4 20 19 28 25 25<br />
26 United States 24.8 26 25 27 23 23<br />
27 Lithuania 25.2 27 24 19 29 27<br />
28 Latvia 26.4 28 28 20 28 28<br />
29 Romania 28.6 29 29 29 27 29<br />
If you’re looking <strong>for</strong> <strong>the</strong> best place to grow up,<br />
head <strong>for</strong> The Ne<strong>the</strong>rlands – top <strong>of</strong> <strong>the</strong> league<br />
in child well-being among <strong>the</strong> world’s richest<br />
countries. The Ne<strong>the</strong>rlands is <strong>the</strong> only country<br />
ranked among <strong>the</strong> top five rich nations in all five<br />
dimensions <strong>of</strong> child well-being that were measured<br />
in <strong>the</strong> study:<br />
• wealth<br />
• health and safety<br />
• education<br />
• behaviour and risks<br />
• housing and environment.<br />
Four Nordic countries (Finland, Iceland, Norway and<br />
Sweden) sit just below The Ne<strong>the</strong>rlands at <strong>the</strong> top<br />
<strong>of</strong> <strong>the</strong> table.<br />
unicef.org.uk/rc11<br />
The bottom four places in <strong>the</strong> table are occupied by<br />
three <strong>of</strong> <strong>the</strong> poorest countries in <strong>the</strong> survey (Latvia,<br />
Lithuania and Romania) and by one <strong>of</strong> <strong>the</strong> richest<br />
(<strong>the</strong> United States).<br />
You can see how <strong>the</strong> <strong>UK</strong> compares to o<strong>the</strong>r rich<br />
countries in this table, which ranks <strong>the</strong> 29 countries<br />
according to <strong>the</strong> overall well-being <strong>of</strong> <strong>the</strong>ir children.<br />
Do you see anything that surprises you? Are you<br />
surprised to see that countries like Portugal and<br />
Ireland are higher up <strong>the</strong> league table than <strong>the</strong> <strong>UK</strong>?<br />
Or that <strong>the</strong> United States is almost at <strong>the</strong> bottom<br />
<strong>of</strong> <strong>the</strong> table?<br />
In fact, <strong>the</strong>re doesn’t appear to be a strong<br />
relationship between <strong>the</strong> comparative wealth <strong>of</strong> a<br />
country and overall child well-being – <strong>the</strong> wealth <strong>of</strong><br />
UNICEF <strong>UK</strong><br />
REPORT CARD 11<br />
On <strong>the</strong> well-being <strong>of</strong> children: how does <strong>the</strong> <strong>UK</strong> score? 3