

GHG Inventory in Myanmar: INC Report - GIO Greenhouse Gas ...
GHG Inventory in Myanmar: INC Report - GIO Greenhouse Gas ...
GHG Inventory in Myanmar: INC Report - GIO Greenhouse Gas ...

Create successful ePaper yourself
Turn your PDF publications into a flip-book with our unique Google optimized e-Paper software.
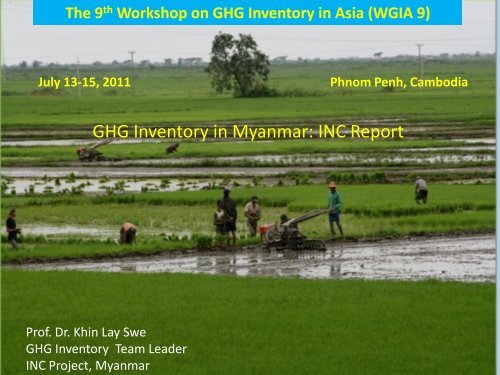
The 9 th Workshop on <strong>GHG</strong> <strong>Inventory</strong> <strong>in</strong> Asia (WGIA 9)<br />
July 13-15, 2011<br />
Phnom Penh, Cambodia<br />
<strong>GHG</strong> <strong>Inventory</strong> <strong>in</strong> <strong>Myanmar</strong>: <strong>INC</strong> <strong>Report</strong><br />
Prof. Dr. Kh<strong>in</strong> Lay Swe<br />
<strong>GHG</strong> <strong>Inventory</strong> Team Leader<br />
<strong>INC</strong> Project, <strong>Myanmar</strong>
Country Profile:<br />
construction materials, <strong>in</strong>dustrial raw materials, consumer goods<br />
• Export: US$ 6.8 billion*<br />
• Import: US$ 4.5 billion*<br />
• Ma<strong>in</strong> Exports: Agriculture, livestock and<br />
forestry products, natural gas<br />
• Ma<strong>in</strong> Imports: Mach<strong>in</strong>ery, transportation and<br />
Role of Agriculture sector<br />
• 43% of GDP (<strong>in</strong>clud<strong>in</strong>g crops (35%), livestock & fisheries<br />
(7%) and forestry (1%))<br />
• 61% of Labor Force<br />
• 44% of Export Earn<strong>in</strong>gs (crops (17%), livestock &<br />
fisheries (20%) and forestry (7%))<br />
*M<strong>in</strong>istry of Commerce, <strong>Myanmar</strong> (2008-09)
Total <strong>Greenhouse</strong> <strong>Gas</strong> Emissions from Energy Sector 2000 (Gg)<br />
Emission sources CO 2 CH 4 N 2 O Total CO 2 e<br />
Fuel Combustion<br />
- Fossil fuel combustion<br />
-Traditional biomass fuel<br />
combustion*<br />
7,658.65<br />
(27,475.3)<br />
0.46<br />
(7.36)<br />
0.28<br />
(0.98)<br />
7755.11<br />
(28297.82)<br />
Fugitive emissions from<br />
coal m<strong>in</strong><strong>in</strong>g<br />
Fugitive emissions from<br />
oil and gas systems<br />
- 0.53 - 11.13<br />
- 4.63 - 97.23<br />
Total 7,658.65 5.62 0.28 7,863.47<br />
*Not <strong>in</strong>cluded <strong>in</strong> national <strong>GHG</strong> <strong>in</strong>ventory calculations.
Proportions of CO 2 -equivalent Emissions from Energy Sector
<strong>GHG</strong> Emissions from Industrial Processes and Product Use, 2000 (Gg)
Sown Area of Major Crops (,000 ha)<br />
Sr. No. Crop Name 2009-2010 Percentage<br />
1. Paddy 8067 47.5<br />
2. Sesamum 1634 9.6<br />
3. Green gram 1077 6.3<br />
4. Black gram 1023 6.0<br />
5. Sunflower 883 5.2<br />
6. Groundnut 866 5.1<br />
7. Pigeon pea 616<br />
8. Other Pulses 706<br />
9. Wheat & Maize 466<br />
10. Rubber 463<br />
11. Cotton 359<br />
12. Sorghum 224<br />
13. Sugercane 160<br />
14. Oil Palm 112<br />
15. Coffee 24<br />
16. Vegetables 270<br />
17. Others 19<br />
Total Crop Area 16969
Country Profile:<br />
• Area 6 7 6 , 5 5 7 Km 2 ,<br />
between 9° 32' N to<br />
28° 32'N; 92° 10' E to<br />
101° 11'E<br />
• Population: 57.5m<br />
• 135 nationalities<br />
Major Rice Produc<strong>in</strong>g Areas<br />
Ayeyarwady Region is<br />
the rice bowl of<br />
<strong>Myanmar</strong><br />
Divisions<br />
Share<br />
<strong>in</strong> rice<br />
area<br />
(%)<br />
Share<br />
<strong>in</strong><br />
popula<br />
tion<br />
(%)<br />
Ayeyarwady 29 14<br />
Bago 16 10<br />
Saga<strong>in</strong>g 12 11<br />
Yangon 9 12<br />
Others 34 53<br />
7
• The sharp <strong>in</strong>crease <strong>in</strong> rice area after 1993 attributed to the additional rice area<br />
for summer rice.<br />
• The <strong>in</strong>crease summer rice area, coupled with the yield <strong>in</strong>crease, resulted <strong>in</strong> a<br />
significant <strong>in</strong>crease <strong>in</strong> rice production after 1993<br />
“Lowland Rice-based Ecosystems <strong>in</strong> Nyaungdon Township of Ayeyarwaddy” Garcia, et.al. 2010, ASEAN Round<br />
Table Meet<strong>in</strong>g, <strong>Myanmar</strong>
Terrace upland rice fields <strong>in</strong><br />
Northern Shan State<br />
Rice Ecosystems <strong>in</strong> <strong>Myanmar</strong><br />
Sr. Type %<br />
1 Irrigated 30<br />
2 Favorable Ra<strong>in</strong>-fed Area 38<br />
3 Drought Prone Area 12<br />
4 Deepwater, submerged and<br />
salt affected Rice<br />
5 Upland rice 3<br />
17<br />
Irrigated rice fields <strong>in</strong><br />
Northern Shan State
Transplant<strong>in</strong>g <strong>in</strong> Flooded Areas<br />
Lowland Areas
Construction of New Reservoirs and Dams<br />
Irrigation Facilities <strong>in</strong>stalled <strong>in</strong> the last 2 decades: 228 Large and Small Rural Dams<br />
Lift<strong>in</strong>g water from rivers:<br />
322 river-pump stations established<br />
to area of 0.47 m ac<br />
11
Promot<strong>in</strong>g Ecosystem Based-Adaptation<br />
Supplementary Water for Rice<br />
Production, Central <strong>Myanmar</strong><br />
A Total of 7974 tube wells:<br />
Shallow / Deep tube wells - for<br />
> 100,000 acres, after 2007-08<br />
Treadle-pump/ Tripod pump
Paddy Harvest Time <strong>in</strong> Central <strong>Myanmar</strong>
Livestock Population Census (<strong>in</strong> millions)<br />
K<strong>in</strong>d of Animal 2000-01<br />
Cattle 10.98<br />
Buffalo 2.44<br />
Sheep & Goat 1.80<br />
Pigs 3.97<br />
Chickens 47.75
<strong>GHG</strong> Emissions / Removals from LULUCF Sector <strong>in</strong> 2000<br />
Activity<br />
CO 2 emissions<br />
(Gg)<br />
CO 2 removals<br />
(Gg)<br />
Net CO 2 emissions/<br />
removals (Gg)<br />
Natural forests - 129 838.59 (-) 129 838.59<br />
Forest plantations 1 863.21 11 750.04 (-) 9 886.833<br />
Home garden trees - 470.07 (-) 470.07<br />
Roadside trees - 162.49 (-) 162.49<br />
Shift<strong>in</strong>g cultivation 1 200.67 - (+) 1 200.674<br />
Deforestation 37 340.97 - (+) 37 340.974<br />
TOTAL 40 404.73 142 221.2 (-) 101 816.5
<strong>GHG</strong> Emissions and Removals <strong>in</strong> <strong>Myanmar</strong> for the Year 2000<br />
ource / S<strong>in</strong>k<br />
CO2<br />
Removal<br />
CO2<br />
Emission<br />
CO CH4 N2O Nox<br />
CO2 Equ.<br />
Total<br />
CO2<br />
Equ.Net<br />
Emission<br />
nergy Sector 7658.65 5.62 0.28 7863.47 7863.47<br />
dustry Sector 248.59 463.29 463.29<br />
griculture<br />
ector 0.81 963.76 8.4 0.022 22844.57 22844.57<br />
142221.2<br />
orestry Sector<br />
33656.51 2215.37 144.85 4.26 34.08 40404.73 -101816.5<br />
aste Sector 134.57 2825.97 2825.97<br />
OTAL 142221.2 41563.75 2216.18 1248.77 12.94 34.10 74402.03 -67819.2<br />
Source: <strong>INC</strong> <strong>Report</strong>, 2010
<strong>Myanmar</strong> National <strong>GHG</strong> <strong>Inventory</strong> of Agriculture Sector<br />
<strong>in</strong> 2000<br />
Sources<br />
CH4<br />
(Gg)<br />
N20<br />
(Gg)<br />
Nox<br />
(Gg)<br />
CO<br />
(Gg)<br />
CO2 (Gg)<br />
Equavalen<br />
t<br />
Rice Cultivation 507.26 10652.46<br />
Agricultural soils 8.2 2542.0<br />
Agricultural residue<br />
burn<strong>in</strong>g<br />
0.0238 0.0006 0.81 0.022 1.6058<br />
Livestock sector 456.50 9648.5<br />
(a) Enteric fermentation 404.43 8493.03<br />
(b) Manure management 52.07 0.2 1155.47<br />
TOTAL 22844.57
<strong>GHG</strong> Emissions and Removals <strong>in</strong> <strong>Myanmar</strong><br />
for the Year 2000<br />
Share of emission by sector (%)<br />
Waste, 3.8<br />
Energy, 10.6<br />
Industrial processes<br />
and product use, 0.6<br />
LULUCF, 54.3<br />
Agriculture,<br />
30.7
Emission / Removal (Gg)<br />
<strong>GHG</strong> Emissions and Removals <strong>in</strong> <strong>Myanmar</strong><br />
for the Year 2000<br />
Energy<br />
Industrial processes and product use<br />
Agriculture<br />
LULUCF<br />
Waste<br />
Net Removal<br />
150000<br />
100000<br />
50000<br />
0<br />
Emission (Gg)<br />
Removal(Gg)<br />
-50000<br />
-100000<br />
-150000<br />
Sectors
“<strong>Myanmar</strong> do not have the carbon debt to<br />
the world, and we are still one of the<br />
lowest emitters <strong>in</strong> capita terms. But we do<br />
have a shared responsibility for the world.”
Limitations and Constra<strong>in</strong>ts<br />
‣ Lack of Institutional arrangements for data<br />
collection, analyz<strong>in</strong>g, verify<strong>in</strong>g and updat<strong>in</strong>g data<br />
‣ Research, assessment and verification for certa<strong>in</strong><br />
activity data , and country-specific emission factors<br />
rema<strong>in</strong>s <strong>in</strong>complete<br />
‣ Lack of f<strong>in</strong>ancial and technical support for<br />
develop<strong>in</strong>g CS Efs<br />
‣ There is an <strong>in</strong>adequate <strong>GHG</strong>I technical experts <strong>in</strong><br />
the m<strong>in</strong>istries and agencies<br />
‣ Difficult to engage full time committed and<br />
dedicated team members
Lessons Learned,<br />
Future<br />
Problems<br />
<strong>Inventory</strong><br />
& Challenges<br />
‣ For prepar<strong>in</strong>g SNC: The activities or plans for the<br />
next <strong>GHG</strong> <strong>in</strong>ventory has not sett<strong>in</strong>g up<br />
‣ Sett<strong>in</strong>g up an <strong>in</strong>stitutional framework, an<br />
organization system, and capable technical<br />
expertise<br />
‣ To develop a permanent system for National <strong>GHG</strong>I<br />
preparation; A National <strong>GHG</strong> <strong>Inventory</strong> Office needs<br />
to be established to coord<strong>in</strong>ate the <strong>GHG</strong> <strong>in</strong>ventory<br />
‣ In the system, various Government agencies, policy<br />
makers and scientists, researchers should be<br />
<strong>in</strong>volved<br />
‣ It needs a project: “Capacity Build<strong>in</strong>g for National<br />
<strong>GHG</strong>I” to strengthen the capacity and help to<br />
improve the <strong>GHG</strong>I
Proposed Action Plans for SNC<br />
• Formulate and support to establish a strong <strong>GHG</strong><br />
<strong>Inventory</strong> <strong>in</strong>stitutional mechanism<br />
• Formulate effective, efficient and proactive overall<br />
development policy and <strong>in</strong>stitutional mechanism of<br />
mitigation and adaptation to the impacts of CC on<br />
agriculture and food security<br />
• Strengthen national research and extension programs<br />
<strong>in</strong> the context of CC<br />
• Improve the regional <strong>in</strong>formation shar<strong>in</strong>g networks,<br />
dissem<strong>in</strong>ation and analysis on CC<br />
• Technical and f<strong>in</strong>ancial assistances on above action<br />
plans
![GHG Inventory of LULUCF Sector in Malaysia [PDF: 894KB] - GIO ...](https://img.yumpu.com/41256149/1/190x143/ghg-inventory-of-lulucf-sector-in-malaysia-pdf-894kb-gio-.jpg?quality=85)
![Workshop Proceedings [PDF: 9.4MB] - GIO Greenhouse Gas ...](https://img.yumpu.com/32682497/1/184x260/workshop-proceedings-pdf-94mb-gio-greenhouse-gas-.jpg?quality=85)
![Transport sector in Myanmar [PDF: 1.8MB]](https://img.yumpu.com/9949363/1/190x143/transport-sector-in-myanmar-pdf-18mb.jpg?quality=85)