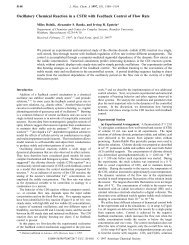
<strong>Nonlinear</strong> <strong>Chemical</strong> <strong>Dynamics</strong> J. Phys. Chem., Vol. 100, No. 31, 1996 13143 Figure 12. Turing patterns in the CIMA reaction. traps into which an iodide ion can fall <strong>and</strong> remain until the complex breaks up. The net result is that the effective diffusion rate of I - decreases significantly, by a factor that depends upon the concentration of starch <strong>and</strong> the stability constant of the complex. The starch thus provides a way of making iodide diffuse significantly slower than chlorite, satisfying condition 4, <strong>and</strong> making possible the emergence of Turing patterns. Typical patterns are shown in Figure 12. The above qualitative argument can be made more rigorous <strong>and</strong> generalized into an approach for designing other systems that can exhibit Turing patterns. 187 If one has an activatorinhibitor system with a homogeneously stable steady state, one seeks a complexing agent that reversibly forms an immobile, unreactive complex with the activator. If the stability constant for complex formation is K <strong>and</strong> the concentration of complexing agent is C, then the time scales for the evolution <strong>and</strong> diffusion of the activator <strong>and</strong> inhibitor become separated by a factor σ ) 1 + KC. The composition of the steady state is unchanged, but its stability is modified. In Figure 13 we show a bifurcation diagram for the CDIMA reaction with r set at the physically reasonable value of 1.5. We see that in the absence of complexation (σ ) 1) the solid Hopf curve lies above the dashed Turing curve, so that as we lower b by changing the reactant composition, oscillation sets in before Turing patterns can arise. When σ is made sufficiently large, e.g., 10, Turing patterns occur in the region below the dashed <strong>and</strong> above the solid line. The Turing patterns observed experimentally occur as a twodimensional layer in a three-dimensional medium. Typically, different reactants are fed into the two ends of a cylindrical slab of gel, <strong>and</strong> the conditions for Turing patterns are satisfied only in a relatively thin strip parallel to the gel faces <strong>and</strong> perpendicular to the concentration gradients that are set up as a result of the input flows <strong>and</strong> diffusion of species within the gel. Detailed calculations on the model equations (11) <strong>and</strong> (12) supplemented with diffusion terms yield accurate predictions of the experimental location of the
13144 J. Phys. Chem., Vol. 100, No. 31, 1996 Epstein <strong>and</strong> Showalter patterns evolve by the growth, elongation, <strong>and</strong> splitting of spots in a fashion that is strikingly reminiscent of the reproduction of single-celled organisms. IX. Outlook It has been well over 150 years since chemists began to notice that chemical reactions often occur with surprising dynamical complexity. For most of this long history, however, there has been a decided resistance in the chemistry community to accepting such notions as chemical oscillations. Today, thanks to several decades of intense experimental <strong>and</strong> theoretical research activity, we know that oscillatory behavior is not only possible but, indeed, common in chemical systemss<strong>and</strong> it may well be the norm when we include the chemistry of living systems. Nonetheless, chemistry colleagues may still ask, “But is this stuff good for anything?” The answer is, emphatically, “Yes!” Over the past two decades, nonlinear dynamics has flourished in the physical <strong>and</strong> biological sciences because it is seen to be a powerful tool for underst<strong>and</strong>ing complexity in nature. <strong>Chemical</strong> systems have played an important role in advancing the field because they are particularly amenable to experimental <strong>and</strong> theoretical analyses <strong>and</strong>, hence, serve as ideal model systems. Perhaps the greatest success along these lines can be found in the application of the principles of excitable media to cardiology. Studies, pioneered by Winfree, on wave behavior in the BZ reaction <strong>and</strong> other excitable media have led to an underst<strong>and</strong>ing of the role spiral waves play in heart maladies such as tachycardia <strong>and</strong> fibrillation. 194 It would not be an overstatement to say that these studies have resulted in a fundamental paradigm shift in cardiology. Opportunities abound for using the principles of nonlinear chemical dynamics to better underst<strong>and</strong> the dynamical behavior of living systems. Recently discovered calcium waves in the cytoplasm of frog oocytes, 195 for example, give rise to spectacular spiral behavior much like that seen in the BZ reaction. What function these waves serve is not known, nor is much known about their underlying reaction-diffusion dynamics; however, their origin undoubtedly lies in oscillatory behavior involving calcium induced calcium release. 196 Simple fronttype calcium waves 197 are known to occur on the surface of oocytes in many different species following fertilization, 198 <strong>and</strong> it seems likely that intercellular spiral waves will be found in many species as well. Another exciting opportunity lies in developing an underst<strong>and</strong>ing of the dynamics of the cell cyclesan important oscillatory reaction, indeed! Recent studies by Tyson <strong>and</strong> Novak 199 have pinpointed key intermediate species in the “chemical” mechanism, allowing the construction of a model that generates behavior in remarkably good agreement with experimental measurements. This model might well be the beginnings of a “mathematical model of the cell”, which could provide insights into living systems in much the same spirit as mathematical modeling of highly complex systems such as the atmosphere. 200 While applications to biological systems seem to be a “natural” for future opportunities in nonlinear dynamics, it is important not to lose sight of the impact fundamental studies have hads<strong>and</strong> will haveson “core” chemistry. Studies of the Pt-CO system, 176 for example, have demonstrated that spatiotemporal behavior must be taken into account for a complete underst<strong>and</strong>ing of the surface-catalyzed reaction. It is likely that the behavior characterized in these studies will be applicable to many other systems involving surface catalysis, some with great practical importance. Studies of model systems in electrochemistry 101 offer equally important spinoffs, with recent studies showing that spatiotemporal behavior may also play an important role in many electrochemical processes. 201 Control techniques for stabilizing dynamical states have great potential for practical applications in chemistry. 110 These methods allow real-time manipulation of a chemical process by targeting <strong>and</strong> stabilizing desired dynamical states. Applications of control could potentially improve the performance of complex chemical manufacturing processes as well as dynamical processes in related fields such as combustion chemistry. Perhaps the most important outcome stemming from studies of chemical oscillations, patterns, <strong>and</strong> chaos is the expansion of chemistry itself. The design <strong>and</strong> development of dozens of new oscillatory chemical reactions not only supplied dynamicists with new <strong>and</strong> different systems for characterization, but a great deal of new chemistry has been developed in the process. Oxyhalogen chemistry as well as the chemistry of sulfur, nitrogen, peroxide, manganese, <strong>and</strong> many metal ion complexes has seen enormous growth in terms of basic chemical underst<strong>and</strong>ing. Studies of propagating waves <strong>and</strong> pattern formation have shown how chemical reactions are transformed when they are intimately coupled with diffusion or other forms of transport. We also now know that it may be impossible to predict the future behavior of a chemical system if it contains elements of feedback appropriate for chaotic dynamics. Studies of oscillations, patterns, <strong>and</strong> chaos in chemical systems constitute an exciting new frontier of chemistry. Still in its adolescence, the field holds enormous promise <strong>and</strong> opportunity for unraveling the chemical complexities of nature. Acknowledgments. I.R.E. thanks the National Science Foundation (CHE-9023294), <strong>and</strong> K.S. thanks the National Science Foundation (CHE-9531515), the Office of Naval Research (N00014-95-1-0247), <strong>and</strong> the Petroleum Research Fund (29565-AC6) for supporting this work. References <strong>and</strong> Notes (1) Fechner, G. Th. Schweigg J. Chem. Phys. 1828, 53, 129. (2) Liesegang, R. E. Z. Phys. Chem. 1905, 52, 185. (3) Luther, R. Elektrochem. 1906, 12, 596. For a translation <strong>and</strong> discussion of this article, see: Arnold, R.; Showalter, K.; Tyson, J. J. J. Chem. Educ. 1987, 64, 740. Showalter, K.; Tyson, J. J. J. Chem. Educ. 1987, 64, 742. (4) Lotka, A. J. J. Am. Chem. Soc. 1920, 42, 1595. (5) Bray, W. C. J. Am. Chem. Soc. 1921, 43, 1262. (6) Rice, F. O.; Reiff, O. M. J. Phys. Chem. 1927, 31, 1352. Peard, M. G.; Cullis, C. F. Trans. Faraday Soc. 1951, 47, 616. (7) This view can, of course, be contradicted simply by looking around <strong>and</strong> observing, particularly in living organisms, the many examples of chemically generated temporal <strong>and</strong> spatial pattern formation. (8) Glansdorff, P.; Prigogine, I. Thermodynamic Theory of Structure, Stability <strong>and</strong> Fluctuations; Wiley: New York, 1971. Nicolis, G.; Prigogine, I. Self-Organization in Nonequilibrium Systems; Wiley: New York, 1977. (9) Belousov, B. P. Sb. Ref. Radiats. Med. 1958; Medgiz: Moscow, 1959; p 145. The early history of the Belousov-Zhabotinsky reaction is described in: Winfree, A. T. J. Chem. Educ. 1984, 61, 661. (10) Zhabotinsky, A. M. Proc. Acad. Sci. USSR 1964, 157, 392. (11) Zaikin, A. N.; Zhabotinsky, A. M. Nature 1970, 225, 535. Zhabotinsky, A. M.; Zaikin, A. N. In Oscillatory Processes in Biological <strong>and</strong> <strong>Chemical</strong> Systems II; Sel’kov, E. E., Ed.; Nauka: Puschino, 1971; p 279. Zhabotinsky, A. M.; Zaikin, A. N. J. Theor. Biol. 1973, 40, 45. For a historical review, see also: Zhabotinsky, A. M. <strong>Chaos</strong> 1991, 1, 379. (12) Chance, B.; Pye, E. K.; Ghosh, A. K.; Hess, B., Eds. Biological <strong>and</strong> Biochemical Oscillators; Academic Press: New York, 1973. (13) Prigogine, I.; Lefever, R. J. Chem. Phys. 1968, 48, 1695. (14) Field, R. J.; Körös, E.; Noyes, R. M. J. Am. Chem. Soc. 1972, 94, 8649. (15) Edelson, D.; Field, R. J.; Noyes, R. M. Int. J. Chem. Kinet. 1975, 7, 417. (16) Field, R. J.; Noyes, R. M. J. Chem. Phys. 1974, 60, 1877. (17) Geiseler, W.; Föllner, H. H. Biophys. Chem. 1977, 6, 107. (18) De Kepper, P.; Epstein, I. R.; Kustin, K. J. Am. Chem. Soc. 1981, 103, 6121. Papsin, G. A.; Hanna, A.; Showalter, K. J. Phys. Chem. 1981, 85, 2575.
- Page 1 and 2: 13132 J. Phys. Chem. 1996, 100, 131
- Page 3 and 4: 13134 J. Phys. Chem., Vol. 100, No.
- Page 5 and 6: 13136 J. Phys. Chem., Vol. 100, No.
- Page 7 and 8: 13138 J. Phys. Chem., Vol. 100, No.
- Page 9 and 10: 13140 J. Phys. Chem., Vol. 100, No.
- Page 11: 13142 J. Phys. Chem., Vol. 100, No.
- Page 15 and 16: 13146 J. Phys. Chem., Vol. 100, No.