full report - National Audit Office
full report - National Audit Office
full report - National Audit Office

Create successful ePaper yourself
Turn your PDF publications into a flip-book with our unique Google optimized e-Paper software.
The youth justice system in England and Wales: Reducing offending by young people Part Two 27<br />
2.18 Reductions in custody numbers have the scope to release cash, because existing<br />
custodial spaces can be decommissioned. Decommissioning is not straightforward:<br />
to make savings whole wings or establishments need to be shut, and movements of<br />
offenders have to be handled care<strong>full</strong>y to avoid destabilisation and reduce the risk of<br />
disruption to sentence plans. There must also be some confidence that downward<br />
trends will not be reversed as, once closed, secure establishments cannot easily<br />
be reopened.<br />
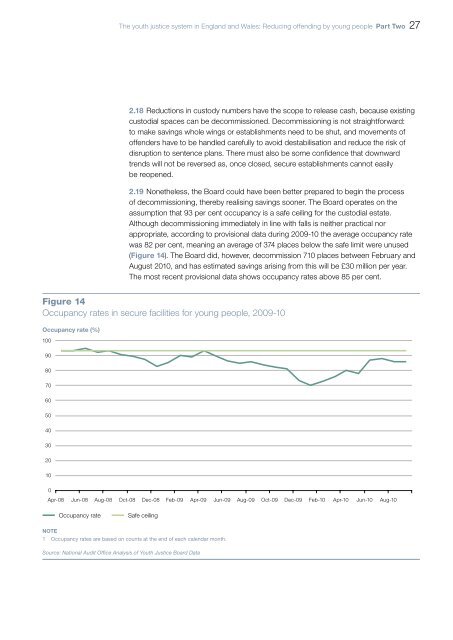
2.19 Nonetheless, the Board could have been better prepared to begin the process<br />
of decommissioning, thereby realising savings sooner. The Board operates on the<br />
assumption that 93 per cent occupancy is a safe ceiling for the custodial estate.<br />
Although decommissioning immediately in line with falls is neither practical nor<br />
appropriate, according to provisional data during 2009‐10 the average occupancy rate<br />
was 82 per cent, meaning an average of 374 places below the safe limit were unused<br />
(Figure 14). The Board did, however, decommission 710 places between February and<br />
August 2010, and has estimated savings arising from this will be £30 million per year.<br />
The most recent provisional data shows occupancy rates above 85 per cent.<br />
Figure 14<br />
Occupancy rates in secure facilities for young people, 2009-10<br />
Occupancy rate (%)<br />
100<br />
90<br />
80<br />
70<br />
60<br />
50<br />
40<br />
30<br />
20<br />
10<br />
0<br />
Apr-08 Jun-08 Aug-08 Oct-08 Dec-08 Feb-09 Apr-09 Jun-09 Aug-09 Oct-09 Dec-09 Feb-10 Apr-10 Jun-10 Aug-10<br />
Occupancy rate<br />
Safe ceiling<br />
NOTE<br />
1 Occupancy rates are based on counts at the end of each calendar month.<br />
Source: <strong>National</strong> <strong>Audit</strong> <strong>Office</strong> Analysis of Youth Justice Board Data