Law Enforcement Management and Administration Statistics, 1990 ...
Law Enforcement Management and Administration Statistics, 1990 ...
Law Enforcement Management and Administration Statistics, 1990 ...

Create successful ePaper yourself
Turn your PDF publications into a flip-book with our unique Google optimized e-Paper software.
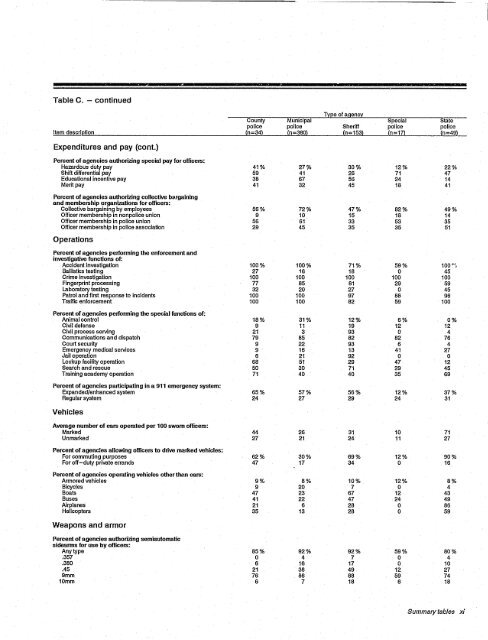
Table C. -<br />
continued<br />
Type of agency<br />
County Municipal Special State<br />
police police Sheriff police police<br />
Item description (n-34) (n-380) (n-153) (n-17) (n-49)<br />
Expenditures <strong>and</strong> pay (cont.)<br />
Percent of agencies authorizing special pay for officers:<br />
Hazardous duty pay 41% 27% 30% 12% 22%<br />
Shift differential pay 59 41 26 71 47<br />
Educational incentive pay 38 67 56 24 14<br />
Merit pay 41 32 45 18 41<br />
Percent of agencies authorizing collective ba,rgaining<br />
<strong>and</strong> membership organizations for officers:<br />
Collective bargaining by employees 56% 72% 47% 82% 49%<br />
Officer membership in non police union 9 10 15 18 14<br />
Officer membership in police union 56 61 33 53 35<br />
Officer membership in police association 29 45 35 35 51<br />
Operations<br />
Percent of agencies performing the enforcement <strong>and</strong><br />
investigative functions of:<br />
Accident investigation 100% 100% 71% 59% 100 01 ,<br />
Ballistics testing 27 16 18 0 45<br />
Crime Investigation 100 100 100 100 100<br />
Fingerprint processing 77 85 81 29 59<br />
Laboratory testing 32 20 27 0 45<br />
Patrol <strong>and</strong> first response to incidents 100 100 97 88 96<br />
Traffic enforcement 100 100 82 59 100<br />
Percent of agencies performing the special functions of:<br />
Animal control 18% 31% 12% 6% 0%<br />
Civil defense 9 11 19 12 12<br />
Civil process serving 21 3 93 0 4<br />
Communications <strong>and</strong> dispatch 79 85 82 82 76<br />
Court security 9 22 93 6 4<br />
Emergency medical services 9 '16 13 41 27<br />
Jail operation 6 21 92 0 0<br />
Lockup facility operation 68 51 29 47 12<br />
Search <strong>and</strong> rescue 50 30 71 29 45<br />
Training academy operation 71 40 40 35 69<br />
Percent of agencies participating in a 911 emergency system:<br />
Exp<strong>and</strong>ed/enhanced system 65% 57% 56% 12% 37%<br />
Regular system 24 27 29 24 31<br />
Vehicles<br />
Average number of cars operated per 100 sworn officers:<br />
Marked 44 26 31 10 71<br />
Unmarked 27 21 24 11 27<br />
Percent of agencies allowing officers to drive marked vehicles:<br />
For commu~ng purposes 62% 30% 69% 12% 90%<br />
For off-duty private err<strong>and</strong>s 47 17 34 0 16<br />
Percent of agencies operating vehicles othertha.n cars:<br />
Armmed vehicles 9% 8% 10% 12% 8%<br />
Bicycles 9 20 7 0 4<br />
Boats 47 23 67 12 43<br />
Buses 41 22 47 24 49<br />
Airplanes 21 6 28 0 86<br />
Helicopters 35 13 28 0 59<br />
Weapons <strong>and</strong> armor<br />
Percent of agencies authorizing semiautomatic<br />
sidearms for use by offICers:<br />
Any type 85% 92% 92% 59% 80%<br />
.357 0 4 7 0 4<br />
.380 6 16 17 0 10<br />
.45 21 38 49 12 27<br />
9mm 76 86 88 59 74<br />
10mm 6 7 18 6 18<br />
Summary tables xi