Key Statistics for Newport West - National Assembly for Wales
Key Statistics for Newport West - National Assembly for Wales
Key Statistics for Newport West - National Assembly for Wales

Create successful ePaper yourself
Turn your PDF publications into a flip-book with our unique Google optimized e-Paper software.
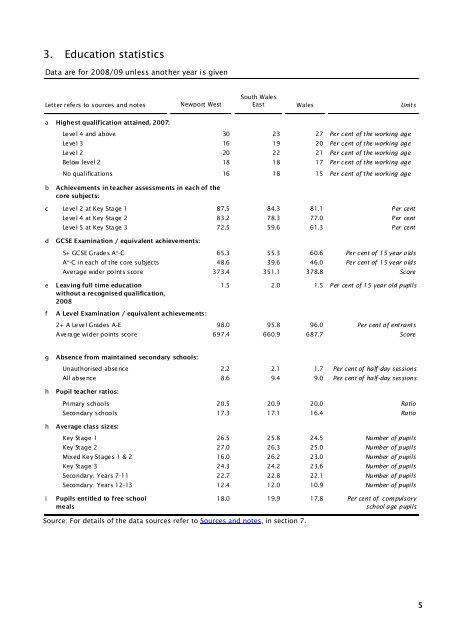
3. Education statistics<br />
Data are <strong>for</strong> 2008/09 unless another year is given<br />
Letter refers to sources and notes<br />
<strong>Newport</strong> <strong>West</strong><br />
South <strong>Wales</strong><br />
East <strong>Wales</strong> Units<br />
a Highest qualification attained, 2007:<br />
Le ve l 4 and above 30 23 27 Per cent of the working age<br />
Le ve l 3 16 19 20 Per cent of the working age<br />
Le ve l 2 20 22 21 Per cent of the working age<br />
Below level 2 18 18 17 Per cent of the working age<br />
No qualifications 16 18 15 Per cent of the working age<br />
b<br />
Achievements in teacher assessments in each of the<br />
core subjects:<br />
c Level 2 at <strong>Key</strong> Stage 1 87.5 84.3 81.1 Per cent<br />
Level 4 at <strong>Key</strong> Stage 2 83.2 78.3 77.0 Per cent<br />
Level 5 at <strong>Key</strong> Stage 3 72.5 59.6 61.3 Per cent<br />
d<br />
GCSE Examination / equivalent achievements:<br />
5+ GCSE Grades A*-C 65.3 55.3 60.6 Per cent of 15 year olds<br />
A*-C in each of the core subjects 48.6 39.6 46.0 Per cent of 15 year olds<br />
Average wider points score 373.4 351.1 378.8 Score<br />
e<br />
Leaving full time education<br />
without a recognised qualification,<br />
2008<br />
1.5 2.0 1.5 Per cent of 15 year old pupils<br />
f<br />
A Level Examination / equivalent achievements:<br />
2+ A Level Grades A-E 98.0 95.8 96.0 Per cent of entrants<br />
Average wider points score 697.4 660.9 687.7 Score<br />
g<br />
h<br />
Absence from maintained secondary schools:<br />
Unauthorised absence 2.2 2.1 1.7 Per cent of half-day sessions<br />
All absence 8.6 9.4 9.0 Per cent of half-day sessions<br />
Pupil teacher ratios:<br />
Primary schools 20.5 20.9 20.0 Ratio<br />
Secondary schools 17.3 17.1 16.4 Ratio<br />
h<br />
Average class sizes:<br />
<strong>Key</strong> Stage 1 26.5 25.8 24.5 Number of pupils<br />
<strong>Key</strong> Stage 2 27.0 26.3 25.0 Number of pupils<br />
Mixed Ke y Stage s 1 & 2 16.0 26.2 23.0 Number of pupils<br />
<strong>Key</strong> Stage 3 24.3 24.2 23.6 Number of pupils<br />
Secondary: Years 7-11 22.7 22.8 22.1 Number of pupils<br />
Secondary: Years 12-13 12.4 12.0 10.9 Number of pupils<br />
i<br />
Pupils entitled to free school<br />
meals<br />
18.0 19.9 17.8 Per cent of compulsory<br />
school age pupils<br />
Source: For details of the data sources refer to Sources and notes, in section 7.<br />
5